Yes, bank credit supply is improving in the €-area.
In a post published just one year ago, we advanced the fairly optimistic view that the negative supply shift in bank credit that took place during the crisis was being gradually reabsorbed and that this development did not contradict the “bold” projections of the ECB, “according to which the €-area economy would, by the end of 2017, have reached again its traditional 2-2 per cent configuration, 2 per cent growth and 2 per cent inflation.” With one more year of data it is useful to see whether that tentatively positive view is confirmed.
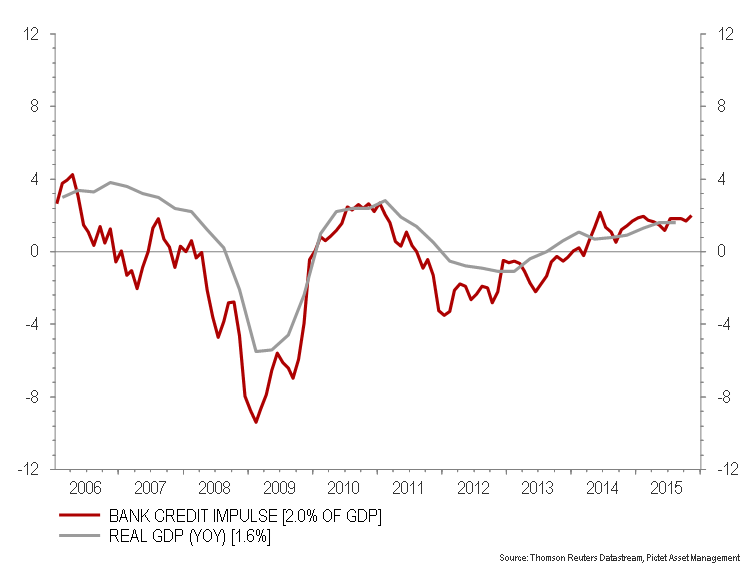
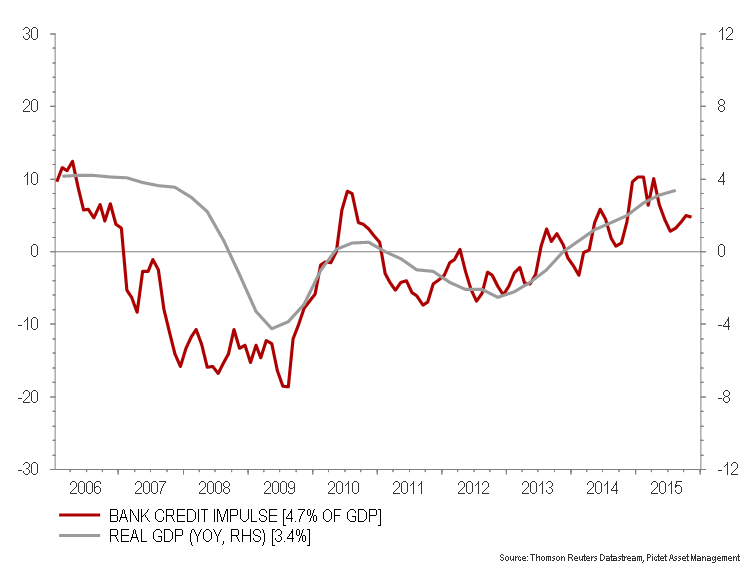
Chart 1 presents the annualized change in the quarterly flow of bank credit relative to GDP, known as the “Credit Impulse”, as well as year on year real growth. In the chart we see the importance of “Credit Impulse” for real growth. In addition, the data for the last few quarters show that both real growth and credit impulse are fairly stable around 1.5-2.0 per cent.
Chart 1 Bank credit impulse and real growth for the €-area. (2006-2015)
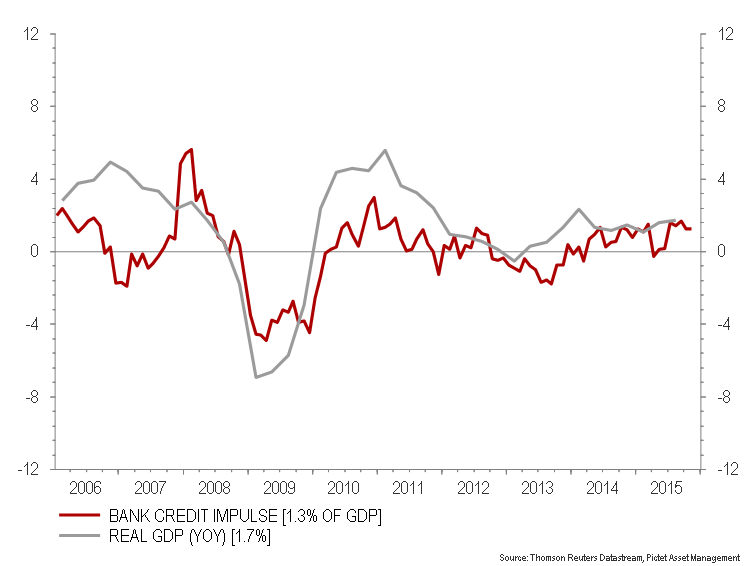
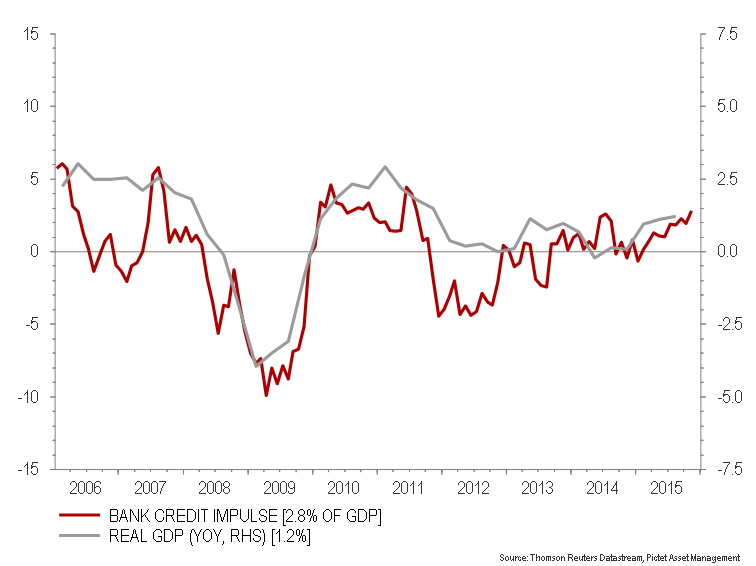
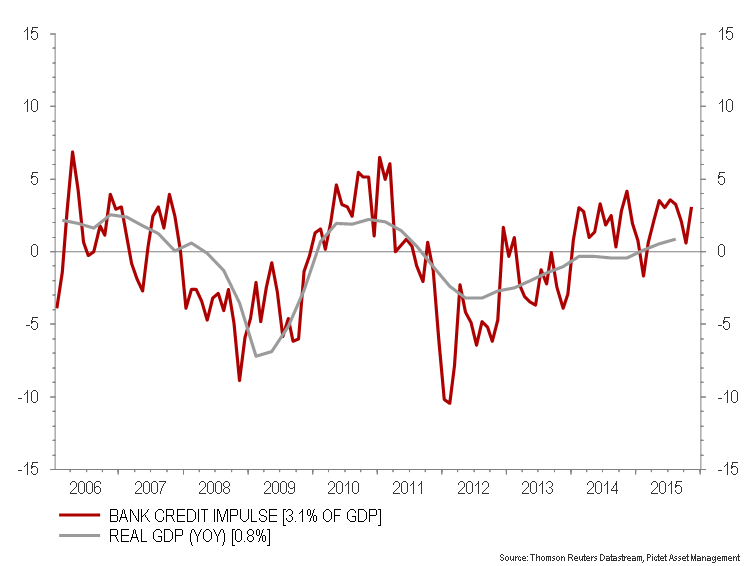
Chart 2 presents in four panels the same data for the four largest €-area economies: Germany, France, Italy and Spain. In it we see that there is still some credit and growth fragmentation, but there are signs in the last few quarters of gradual convergence between the core and periphery, with the Credit Impulse, as well as real growth, positive in all four countries. Spain is doing particularly well both in terms of impulse and growth while Italy is lagging, but some improvement is visible there as well.
Chart 2. Bank impulse and real growth for the four largest €-area economies. (2006-2015)
Panel A: Germany
Panel B: France
Panel C: Italy
Panel D: Spain
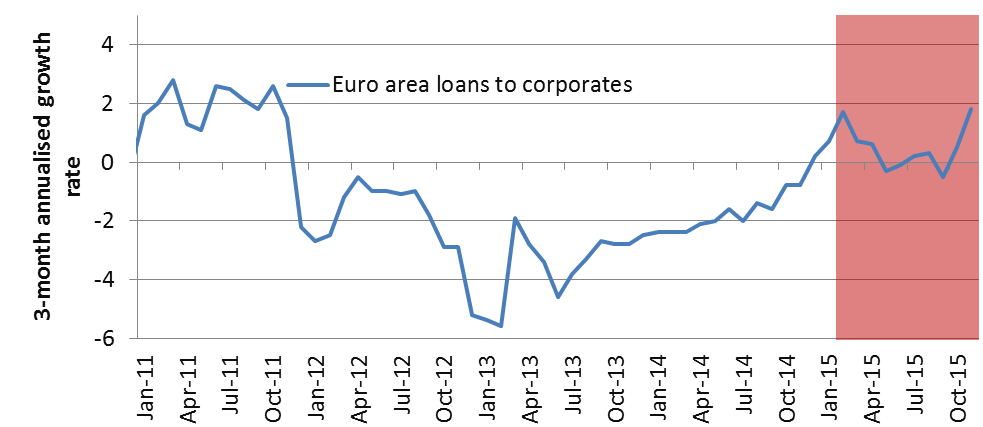
In Chart 3 one sees that the higher growth of bank loans to non-financial firms that was visible at the beginning of 2015 in the €-area was not sustained in subsequent months but has regained strength in November. This is an important development since bank credit to corporations was the variable that had suffered most during the crisis.
Chart 3. Quarterly, seasonally adjusted annualized rates of growth of bank loans to non-financial firms in the €-area. (2011-2015)
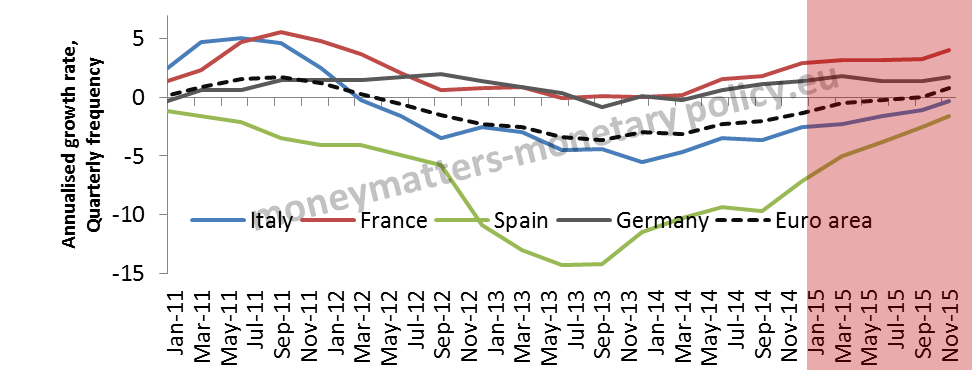
In chart 4 the data for the four largest €-area countries are reported, confirming that the situation remains quite diversified but the rates of growth of the periphery (Span and Italy) are converging towards those of the core (Germany and France).
Chart 4. Quarterly, annualized rates of growth of bank loans to non-financial firms in Germany, France, Italy and Spain*. (2007-2015)
*Neither seasonally nor working day adjusted
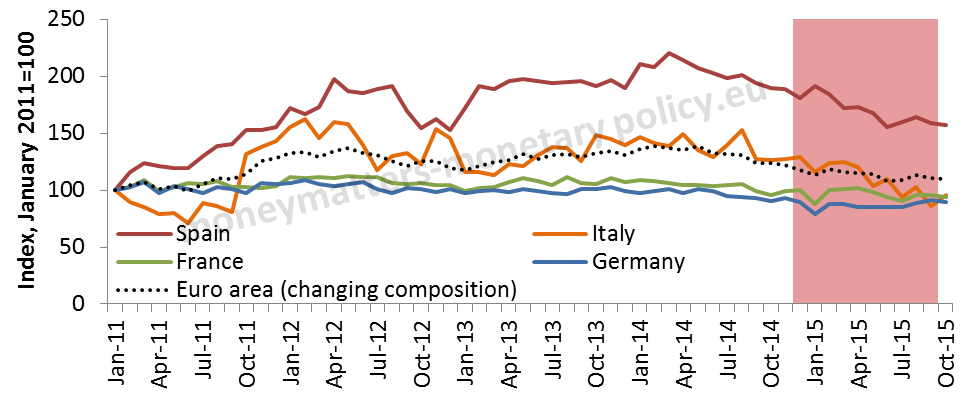
Interestingly, the bank margin data in Chart 5 confirm, from a price perspective, the on-going convergence seen in charts 2 and 4 from a quantity perspective. Here we see that the cost of bank credit, as measured by the spread between the interest rate on bank loans and on deposits, kept going down: mildly in the € area overall but more significantly in Spain and Italy. Indeed in the last country it is at a lower level than at the beginning of 2011.
Chart 5. Bank margins between loan and deposit rate in the €-area (2011-2015) January 2011=100.
In a standard demand-supply scheme a higher quantity and a lower price identify an increased supply, there is thus consistency between the findings in the post of one year ago and in this post: both indicate a reabsorption of the negative supply shift in bank credit that was prevailing for a long time during the crisis.
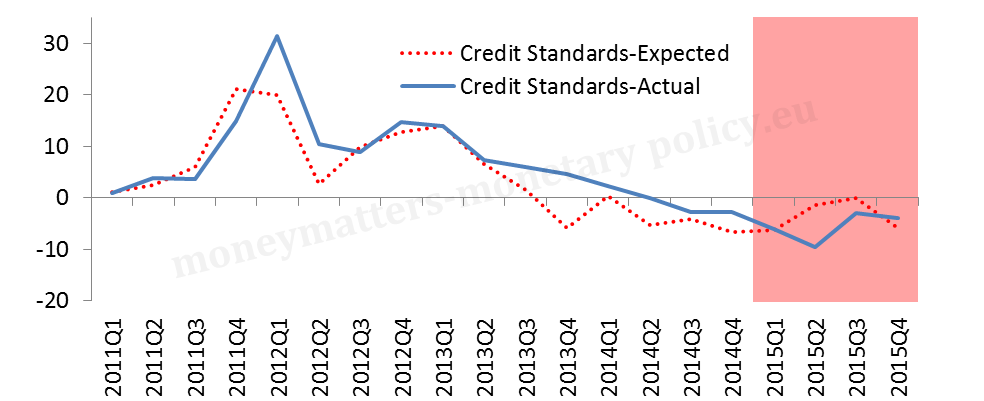
This is confirmed in Chart 6: while at aggregate euro area level credit standards have recently been eased marginally (Panel A), there is a distinct easing in Italy but not in Spain (panel B). The evidence about Italy is quite surprising taking into account the high level of non-performing loans that should limit the propensity of banks to lend.
Overall, the developments in the two largest peripheral countries are similar in one respect but different in another one: in both there is an improvement in credit conditions, but in Spain this appears mostly in the available quantity of bank credit while in Italy it is more evident in its cost and overall conditions, thus pointing to a lack of demand for credit rather than supply constraints.
Chart 6. Changes in actual credit standard on loans to enterprises from the ECB bank lending Survey in the €-area and in Germany, France, Italy and Spain. (2011-2015)
Panel A: €-area
Panel B: Germany, France Italy and Spain
In conclusion, the gradual improvement in the supply of bank credit that we documented last January 1 and whose incipient signs were first noted in a post at the end of 2014 2, has progressed further in the course of 2015, even if at subdued pace. This is evident in both an improvement at €-area aggregate level and in a narrowing of the divide between its periphery and its core. This does not necessarily confirm the “bold” projections of the ECB of a return, in the next couple of years, to the 2 per cent growth 2 per cent inflation paradigm for the €-area, but is not inconsistent either. Passing a more definite assessment about the plausibility of the ECB projections would require extending the analysis to many other variables, in particular in the real economy. Our impression is that more progress is being made towards the 2 per cent paradigm on the activity than on the inflation front. If this was confirmed by incoming data, the ECB would have to further reinforce its measures going forward to firmly re-establish price stability and thus respect its mandate.
This post was jointly written by Steve Donzé of Pictet Asset Management and Francesco Papadia, with the assistance of Madalina Norocea.
