Assessing the Assessment
In assessing the Comprehensive Balance Sheet Assessment in this post I will stick to my expertise and thus to a macroeconomic not a bank perspective. While I will not recall the basics of the exercise, I just repeat as an introduction what I wrote in a post quite some time ago, i.e. that the Comprehensive Balance Sheet Assessment and the transfer of supervision to the ECB presented huge technical and political difficulty. 1 The technical difficulties consisted in the acquisition of new competences by the ECB, the short time available, the size of the task and baroque governance, with unclear decision making between the Supervisory Board and the Governing Council. The political difficulties were, first, the risk of national regulators, which had been in many cases captured by national banks, capturing the ECB; second, the risk that too harsh an attitude by the ECB may lead to court cases and macroeconomic difficulties, while a too bland one would miss the occasion to rehabilitate the €-area banking system. I have always trusted that both political and technical difficulties would be overcome: an institution capable of smoothly introducing a common currency for 11 countries should also be capable to effectively carry out the Comprehensive Balance Sheet Assessment! For the reasons I will illustrate below, I am even more confident now about this favourable outcome, while not being able to fully exclude, of course, negative outcomes.
On the technical side, the information I could collect looking at the documents published by the ECB (such as the SSM reports – the next one will be published in November – and the ECB Comprehensive Assessment Stress Test Manual of August 2014) as well as at the analyses produced by Nicolas Veron of the Bruegel Institute indicates that the ECB has conducted thorough and effective preparation work, with technical preparations extending from HR to IT and harnessing internal and external forces to the task. On the political side, all the information I have also indicates that the European mindedness of the hired officials is pretty high. In addition, it seems that there was a very effective co-operation with national supervisors that saw their independence within national settings increased and bought-in the occasion to rehabilitate their banking system.
The collective action problem that caused so much damage during the crisis, taking often the form of banking nationalism, which added supervision induced fragmentation over market originated fragmentation, seems to have been, to a good extent, surpassed.
The exercise was critical for two reasons. First, because re-establishing a functional banking system is crucial in the €-area, where 80 per cent of the funding of the economy is carried out by banks, while the market covers only the remaining 20 per cent. Second, because the intermediation ability of the €-area banking system is impaired. To clarify what I mean by “impaired intermediation ability” let me have recourse to a simple chart.
Chart 1: Demand and supply of bank loans: definition of impaired bank intermediation

Source: Own interpretation
On the horizontal axis of Chart 1 we have loans, on the vertical axis we have the cost of bank intermediation, the usual downward sloping demand curve and the upward sloping supply curve define equilibrium at their intersection point. Impaired intermediation can be represented in this elementary chart by an upward left shift of the supply curve, leading to a higher price of bank loans and a restriction of bank credit. While we know that the reduction of credit was also determined by demand, there is overwhelming evidence that there has been a substantial supply component, indeed only a negative supply curve shift can explain a contemporaneous price increase and a lower quantity of loans.
Two pieces of evidence are sufficient to illustrate empirically credit impairment. First, according to the ECB Bank Lending Survey (BLS) of April 2014: “The majority (60%) of surveyed banks assessed their current level of credit standards to be tighter than the midpoint of the range of credit standards since 2003.” And about 40% of the banks considered their credit standards for enterprises and mortgages even tighter than the midpoint of the range since the second quarter of 2010, i.e. in an acute phase of the crisis. And notice that, of course, this statistic refers to the entire €-area and one can guess that the bulk of the 60/40 per cent of banks with tighter credit standards are located in the periphery. This obstacle to credit provision was only slightly reduced according to the latest two BLS of July and November 2014.
Second, evidence of the impaired ability of the €-area banking system to provide credit also emerges looking at the intermediation margin of banks, which is the real world counterpart of the cost of funding in chart 1 above. Chart 2, for instance, shows that there are two factors (see left panel) determining the higher cost in Spain of smaller bank loans, which presumably go to SMEs, with respect to the situation in Germany: a higher cost of funding, and in particular of deposits, and a substantially higher intermediation margin, grown by 2.0 per cent with respect to the situation before the crisis (see right panel). The impaired intermediation ability of banks thus appears also in the high price they charge, not only in the low quantity of credit they grant, just as in the theoretical Chart 1.
Chart 2. Cost of small loans and bank margins in Spain and Germany
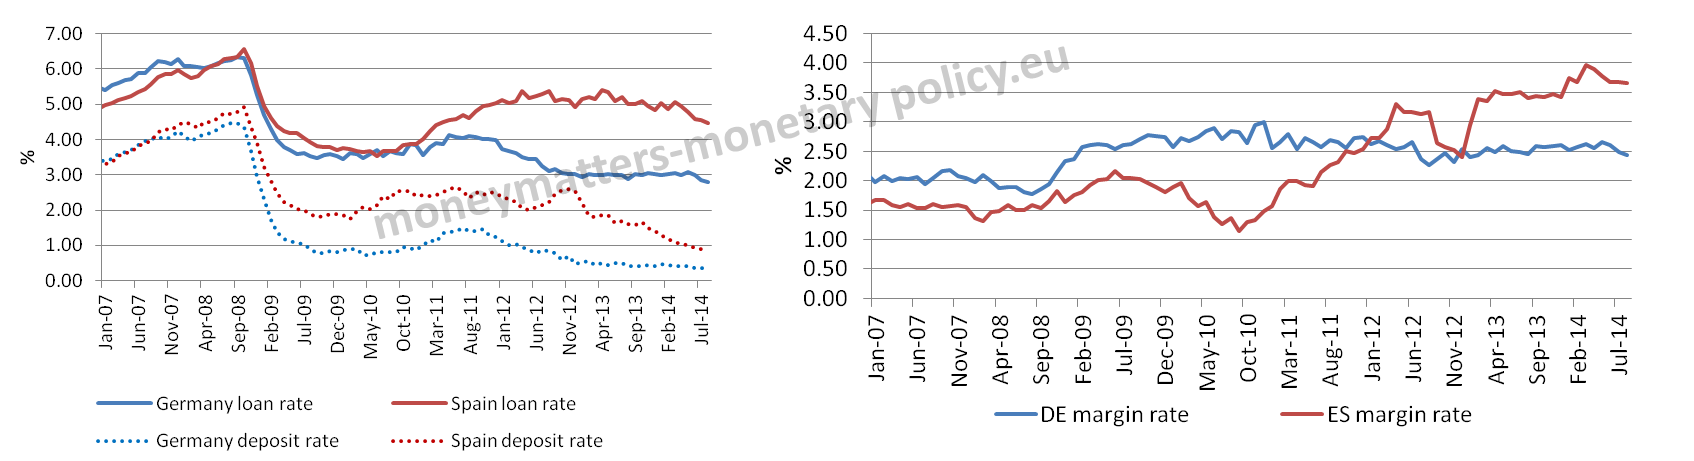
Source: ECB
As one could expect, the Comprehensive Balance Sheet Assessment had an effect even before it was completed, as banks started to put their house in order preparing for the test. Draghi has recently communicated that: “Since the summer of 2013 the banks that will fall under our direct supervision have strengthened their balance sheets by almost €203bn. This includes €59.8 billion of gross equity issuance, €31.6 billion issuance of CoCos, €26 billion of retained earnings, €18.3 billion of asset sales, €17.6 billion of one-off items and additional provisioning, and about €50 billion of other measures.” Similar figures were mentioned by analysts looking into this issue. Also as a consequence of these actions, according to the ECB’s latest Financial Stability Review (May 2014), the median CET1 (Common Equity Tier 1) ratio for a subset of large banking groups stood at 10.4% of risk‐weighted assets at end‐ March 2014. CET1 ratios ranged between 9% and 13%.
So, in aggregate terms, banks entered into the Comprehensive Balance Sheet Assessment having done some preparatory work and with some margin with respect to the minimum capital requirements. But, of course, the balance sheet assessment was just needed to check on those numbers, to carry out a bank by bank and not an aggregate exercise and to test the resilience of banks balance sheets to financial and macroeconomic stress.
Markets normally react to a comparison between market expectations and the actual results. In principle, this should have also happened with the Comprehensive Assessment, with the attention focussed on the difference between expectations and the actual number of failing banks and of total capital gap published by the ECB. This comparison, however, is eminently ambiguous. An analogy can explain this intrinsic ambiguity: assume you read in a newspaper that the police is catching more thieves. You can draw a good as well as a bad conclusion from this piece of information: is this evidence of better action by the police or of more thieves? We don`t know unless we have an objective measure of criminal activity. Unfortunately, we do not have an objective measure, independent of the Comprehensive Balance Sheet Assessment, about the conditions of banks, hence the ambiguity.
Still it is useful to have a sense of what market observers were expecting before the publication of the results. This is reported in Table 1.
Table 1. Market expectations about the result of the AQR and Stress Test.
| Who | Number of banks | Total shortfall |
| Goldman Sachs | 8 | 51 bn EUR |
| RBS | 11 (+18 borderline) | 10.2bn EUR net (16.4 gross) |
| Efe news service | 11 | – |
| Barclays | 8 | – |
| Bloomberg | 25 (lower after measures) | – |
Source: Media, Research pieces
The expectations were mostly modest, with a few second tier banks (between 8 and 11) not passing the tests/needing additional capital. Also the forecast capital gap was not daunting (51 billion € on average according to a Goldman Survey on September ‘14, down from 75 in October ’13, with a range between 10 and 200 billion, and 10 according to RBS). Bloomberg reported a higher figure of 25 banks with a capital gap, coming down to a lower number after the measures taken in 2014 would be taken into account. This number seemed however to result more from a leak than from a forecast. The Financial Times also reported an estimate of 18 banks, representing 11% of the assets of the banks in the test, being at the borderline.
The actual results, as communicated by the ECB, are reported in table 2.
Table 2. Actual results communicated by the ECB for banks with a shortfall
| CET1 ratio at the end of 2013 | 10.0 % |
| AQR adjusted CET1 ratio | 8.4 % |
| Adjusted CET1 Ratio after Baseline Scenario | 7.2% |
| Adjusted CET1 Ratio after Adverse Scenario | 2.1% |
| Capital shortfall | 24.62 bn |
| Net eligible capital raised | 18.59 |
| Capital shortfall post net capital raised | 9.47 bn. |
| Number of banks with a shortfall | 25 (12 have already covered the shortfall) |
Source: ECB, AQR results
The results communicated by the ECB and summarized in table 3 are not far from expectations as regards the number of banks still having to take measures, while the capital gap to be remedied is definitely on the low side of expectations. Also in terms of split per country, the results are not too far from expectations (I 9, GR 4, CY 3, SL 2, BE2, AU, PT, IRL, F, D and E 1), even if the shock about Italy was significant.
How do we assess these results? Nicolas Veron has aptly said: “ …the success or failure of the Comprehensive Assessment is likely to remain a somewhat ambiguous issue in the immediate aftermath of the announcement of its results. …The aggregated capital gap will certainly be the most watched headline number from the process, even though it is not necessarily the most significant. But only time will tell how rigorous the ECB will really be in comparison with the national supervisors it replaces.”
Consistently with this judgment, which I share, it is difficult to assess market reactions because:
1. As I showed, market expectations had become mostly benign before the results were published:
a. With a modest number of banks failing and manageable capital gap,
b. With the prevailing view that the exercise is supposed to be well done, both politically and technically,
2. It is difficult to improve on positive expectations (i.e. to deliver a positive surprise),
3. The results are ambiguous if different from expectations
a. A much lower number of banks and gap may indicate that the ECB was not tough enough,
b. A much higher number of banks and gap may indicate that the situation is much worse than expected.
Still, one has to provide a preliminary answer to the big question, i.e. whether another piece of the puzzle to get out of the crisis, that is a better functioning banking system, has fallen into place. This question can be split in two sub-questions. First, there is the objective question: is the €-area banking system being rehabilitated, in the sense of having a balance sheet structure more capable of intermediating the needed amount of funds at an acceptable price? Second, there is a subjective, perception question: has the fog covering the entire system been dissipated?
In order to answer these two questions it is useful to look at strengths and weaknesses of the exercise.
The strengths in my view are:
1. Thoroughness, the numbers quoted by ECB-EBA on the details of the probing are impressive,
2. A correction of 263 billion due to AQR and stress tests (with capital -CET1- coming down from 12.4 to 8.3) is remarkable,
3. The complaints by Banca d´Italia are a sign that the ECB maintained a tough attitude against the wishes of the central bank of the third largest country in the €-area,
4. The hinted intention to repeat the exercise,
5. The harmonization of bad loans definition,
6. The fact that the market saw new information in the results, severely devaluing the banks with the worst outcome.
While the weaknesses are:
1. No deflation scenario was built in the stress test, even if this was, at least partly, offset by a very tough assumption on activity (-7.0% GDP deviation in 2016),
2. The capital definition was not the so-called “fully phased-in”, which would have meant that 11 more banks would have failed. EBA published, for information, also the results with the “fully phased in” definition and this would have resulted in a further 0.9% fall in the capital ratio,
3. There is a number of borderline cases (partly covered by point 2),
4. No bank has been declared to be resolved.
Overall my sense is that strengths prevail over weaknesses even if, as I said, it is premature to pass a definitive assessment. So, my overall, interim assessment is that it is more likely than not that the Comprehensive Balance Sheet Assessment has dealt with both the objective and the subjective problems of the banking system. What are the variables to monitor in the course of time to see whether indeed this interim statement will be confirmed? I believe there are two main relevant variables: first, bank restructuring, more important over the medium to long run, and, second, credit growth, more important over the short to medium run.
Over the long run, the Comprehensive Balance Sheet Assessment should help bank restructuring, thus improving the long-term functionality of the aggregate banking system, having identified strong banks that can take over those banks that the assessment has revealed to be weak as well as the borderline banks.
As regards credit growth, the question is whether the supply curve of Chart 1 has shifted back to the initial position as a result of the Comprehensive Assessment, thus surpassing the effects of the crisis. Draghi on 9.October.2014 clearly said that he expects this to happen : “Now, as the banking sector is progressively cleaned up and the deleveraging process reaches its conclusion, banks will have new balance sheet capacity to lend, and our monetary policy will become even more effective. I expect credit to pick up soon next year.”
How can one quantify this pick-up? Table 3 provides two alternatives of a back of an envelope exercise. The first alternative notes that, during the crisis, bank credit has slowed down to 0.6 per cent, 7.6 per cent less than before the crisis. Assuming, consistently with my interpretation of the demand/supply balance as it emerges from the Bank Lending Survey, that the deceleration is due for 1/3 to supply factors and 2/3 to demand factors, the rehabilitation of the €-area banking system should bring, by itself, an acceleration of bank credit by 2.5 per cent just because of the disappearance of the supply factor. The second alternative, following analogous lines, starts by noting that supply problems have determined a lower growth of bank credit with respect to nominal GDP growth during the crisis, i.e. the elasticity of bank credit to GDP has come down from 1.16 to 0.49. Under this interpretation, the rehabilitation of the banking sector should bring the growth of bank credit relative to GDP to the pre-crisis level (i.e. re-establish the pre-crisis elasticity). Applying this relationship to the average nominal GDP growth for 2015-2016 (i.e. 2.63 per cent), bank credit growth should be 3.04 per cent, i.e. 1.74 more than the 1.30 per cent that would prevail if the old elasticity would continue to prevail. In conclusion, these simple calculations indicate that the impact effect of a fully rehabilitated banking system (i.e. a downward shift of the supply curve in Chart 1) should be an increase of credit growth between 1.5 and 2.5 per cent. This is significant, starting from a situation where credit growth to the private sector has been negative for a long period (the latest growth was -0.6% in September). Of course both exercises are simplistic. On the overestimating side, they assume the full disappearance of supply problems and do not take into account the lags with which the positive effects will appear. On the underestimating side, they do not incorporate the feed-back between credit and GDP growth neither do they incorporate possible synergy with other monetary policy measures of the ECB, in particular the TLTRO and the ABS purchases. In fact, the limit of these measures is that they provide cheap liquidity but cannot have a significant influence on capital. If this is now remedied by the Comprehensive Balance Sheet Assessment their effect could be increased.
Table 3: Alternative estimates of Comprehensive Balance Sheet Assessment impact on credit growth.
| Average GDP growth % 1999-2007 | 7.09 | Average GDP growth % 2008-2014 | 1.16 |
| Average Loan growth % 1999-2007 | 8.20 | Average Loan % growth 2008-2014 | 0.57 |
| Elasticity | 1.16 | Elasticity | 0.49 |
| GDP forecasted annual growth % 2015-2016 | 2.63 | ||
| AQR effect 1= Acceleration of Credit Growth % remedying impaired supply 1999-2007 | 2.50 | ||
| Credit growth 2015-2016 with pre-crisis elasticity | 3.04 | ||
| Credit growth 2015-2016 with crisis elasticity | 1.30 | ||
| AQR effect 2= Restoration of pre-crisis elasticity for 2015-2016 | 1.74 | ||
Source: IMF WEO, Author’s calculations
I conclude by recalling the obvious fact that, however rehabilitated, the banking system will not be able to provide, on its own, the needed funding to the €-area economy and that a much bigger role will have to be covered by the capital market, including in particular by ABS. But of course this is another story.
*** Madalina Norocea gave assistance in preparing this post.
