Bank credit supply is improving in the €-area
In a post published in this blog at the beginning of November of last year 1 the argument was advanced that “impaired bank intermediation”, which was translated in basic economic language with a shift up and on the left of the supply curve of bank loans, had played a role in the very subdued growth of bank credit during the crisis, even lower than GDP growth would have implied. In that same post, the impact of the unfavourable credit supply conditions on the growth rate of bank loans was guessed to be between 1.5 and 2.5%: if there had been no impairment of bank intermediation, the growth rate of bank credit would have been between 1.5 and 2.5% higher during the crisis. This would have meant that bank credit growth would have been slightly positive instead of being negative (the average annual rate of bank credit growth in the period between 2011 and 2014 has been –1.3%).
In that same post the hypothesis was put forward that the Comprehensive Balance Sheet Assessment of the ECB could effectively deal with the supply factor in the development of bank credit.
This post revisits that hypothesis to check whether there is any indication that it is being verified, or to put in more correct epistemological terms, that it is non-rejected.
Before looking at the most recent developments to find traces of inconsistency with the maintained hypothesis, two important, interrelated, caveats have to be considered:
1. It is not at all clear after which lags the Comprehensive Balance Sheet Assessment could have its positive effects on bank credit,
2. It is not clear either from which date should one start measuring the possible effects of the Comprehensive Balance Sheet Assessment. One possible date is the 31st of December 2013, which is the date at which the balance sheets of the banks were considered by the ECB in its assessment. Another possible date is, of course, the end of October 2014, when the results of the assessment were communicated.
The uncertainty about the timing of the possible effects of the Comprehensive Assessment has to be kept well in mind when considering the empirical developments reported below.
To have a first, overall empirical view of credit developments in the €-area it is useful to look at Chart 1, reporting a definition of “credit impulse”, defined as the annual change of quarterly new private sector borrowing as % of GDP, together with year on year GDP real growth. In the chart one sees a number of interesting facts:
1. A close correlation between real growth and the “credit impulse” variable;
2. The double dip recession in the €-area, with one first, deeper through in 2009 and a second, shallower one between the end of 2011 and the end of 2013;
3. During the second leg of the recession, credit growth got deeper into negative territory than real GDP, indicating a lower intensity of credit per unit of income;
4. A move of both credit and GDP into positive growth territory at the beginning of last year.
Overall, the evidence encourages one to look more closely at bank credit developments to check whether indeed there are incipient signs of an improvement in the supply of credit.
Chart 1. Credit impulse and real growth (2004-2014)

Source: Thomson Reuters Datastream, Pictet Asset Management
As argued in the post mentioned above, three variables can shed some light of the effects of shifts in the supply of bank credit on its growth:
1. Obviously, the growth of bank credit itself;
2. The cost of bank credit;
3. The attitude of banks in extending loans, as measured by the Banking Lending Survey of the ECB.
As regards the growth of bank credit, it is useful, in order to detect incipient changes, to look at loans to non financial firms, which are more variable than those to households 2. Also to detect early signs of credit growth, the seasonally adjusted quarterly annualized rates of growth of bank credit are reported in Chart 2.
Chart 2. Quarterly, seasonally adjusted annualized rates of growth of bank loans to non financial firms in the €-area. (2011-2015)

Source: ECB SDW
Note: The series are loans to non financial corporations, total, 3-month annualised growth rate, working day and seasonally adjusted.
In the chart we clearly see that after more than 3 years of negative growth, bank loans to corporations have just recently recorded a positive, albeit very low, growth rate. To further detect incipient changes in loan flows it is useful to look separately at the core (Germany and France) and at the periphery (Italy and Spain), as in Chart 3.
Chart 3. Quarterly, annualized rates of growth of bank loans to non financial firms in Germany, France, Italy and Spain. (2007-2015)

Source: ECB SDW
Note: The series are loans to non financial corporations, total, neither seasonally nor working day adjusted.
The chart indicates that the recent recovery of bank credit to corporations has been more significant in the periphery, Italy and, particularly, Spain, than in Germany and France.
As regards the cost of bank credit, this can be measured in two ways, first as the sheer cost of bank loans or as the margin between the interest rate on bank loans and that on bank deposits. The latter measure is more relevant in current conditions, given that ECB action has pushed all interest rates down, especially since July 2012.
Chart 4 shows bank margins in the €-area as well as in Germany, France, Italy and Spain. In order to concentrate on the development rather than on the level of bank margins, the variables are represented as index number, based on January 2011.
Chart 4. Bank margins between loan and deposit rate in the €-area (2011-2015) January 2011=100.
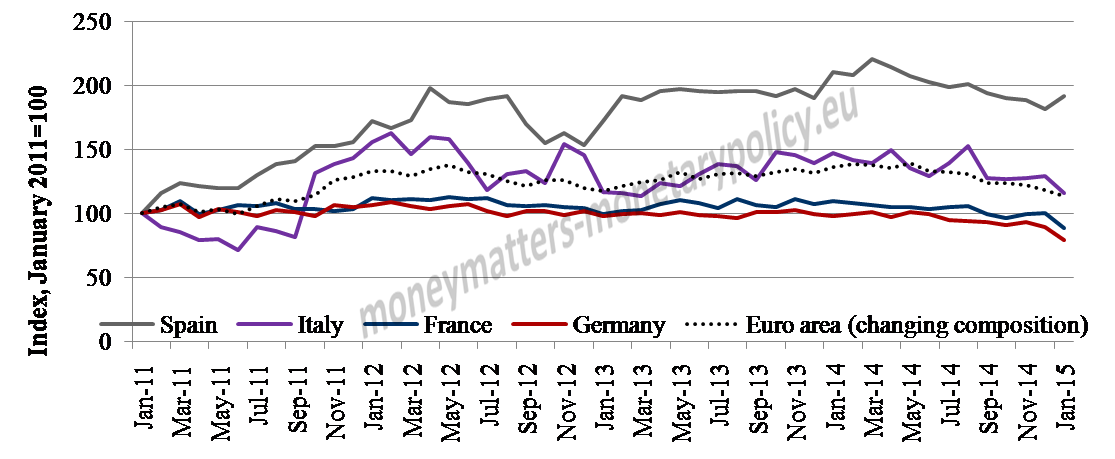
Source: ECB SDW
The charts indicate that bank margins increased quite dramatically during the crisis in Italy and Spain (50% and 100% respectively), consistently with the idea that there was a shift upward and to the left of the supply of bank loans in the periphery, as a result of impaired bank intermediation. The process got in reverse, however, since sometimes around the beginning of 2014, indicating a partial recovery of the ability of banks to intermediate funds in the periphery. It is interesting to observe that, in contrast, bank margins remained about constant over the entire period in the core of France and Germany, with only a slight decrease over the most recent period.
As regards the attitude of banks in extending loans as measured by the Bank Lending Survey of the ECB, Chart 5 reports the changes credit standard for the €-area as well as in its largest economies.
Chart 5. Changes in credit standard on loans to enterprises from the ECB bank lending Survey in the €-area. (2011-2015)
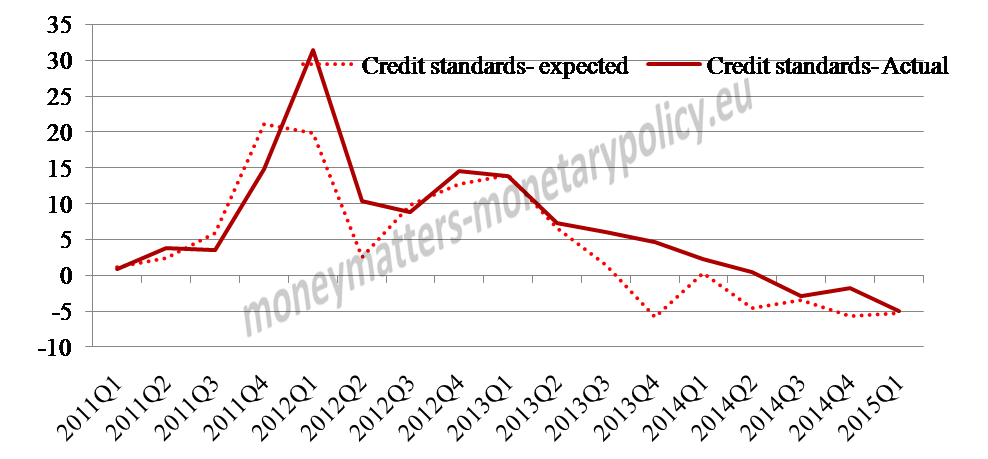
Source: ECB SDW
Note: The series are derived from the Bank Lending Survey. Overall credit standards, weighted net percentage (tightened minus eased), Expected (forward looking 3 months) and actual (backward looking 3 months)
Chart 6. Changes in actual credit standard on loans to enterprises from the ECB bank lending Survey in Germany, France, Italy and Spain. (2011-2015). January 2011=100
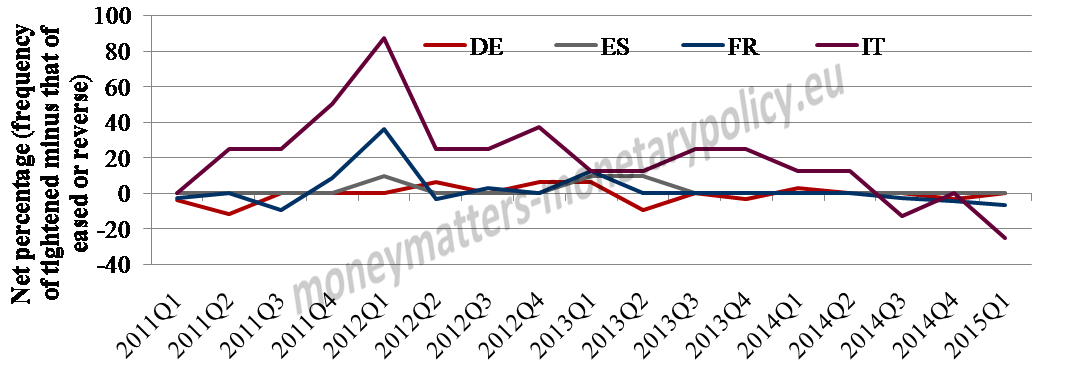 Source: ECB SDW
Note: The series are derived from the Bank Lending Survey. Overall credit standards, weighted net actual (backward looking 3 months)
In the chart one sees a sustained easing of standards in the aggregate €-area, with the balance between tightening and easing banks becoming negative (meaning easing) around the third quarter of last year. This is entirely due to what happened in Italy and Spain since credit standards remained about constant in the core.
The ECB Bank Lending Survey confirms also what was seen in Chart 4 for bank intermediation margins: chart 7 shows that the changes in margins on loans to enterprises have come down, in banks’ own assessment, on a sustained basis and are in negative territory since the second quarter of last year, with the decrease being particularly significant in Spain and Italy.
Chart 7. Changes in margins on average loans to enterprises credit standard from the ECB bank lending Survey in Germany, France, Italy and Spain to non financial corporations (net percentages of banks reporting tightening terms and conditions) (2011-2015)

Source: ECB SDW
In conclusion, when one looks carefully at bank credit developments, concentrating on the lending to enterprises in the periphery, where the crisis exercised its maximum damage, one sees that not only credit flows are recovering but also that bank credit is getting cheaper and banks have a more forthcoming attitude in lending. The hypothesis of a reabsorption of the negative supply shift in bank credit, which took place during the crisis, is not rejected by the evidence presented. While is not easy to establish a precise link with the Comprehensive Balance Sheet Assessment of the ECB, there is a broad timing coincidence between the through of the lending cycle at the turn between 2013 and 2014 and the timing of the ECB exercise, such that one cannot exclude that it contributed to the rehabilitation of the €-.area banking sector. The process is still on-going and further progress is needed for it to indicate a full return to normalization. Still, together with the green-shoots of recovery mentioned by the ECB in recent weeks, we could see the beginning of more favourable prospects for the €-area economy. The projections of the ECB, according to which the €-area economy would, by the end of 2017, have reached again its traditional 2-2 per cent configuration, 2 per cent growth and 2 per cent inflation, still look bold, but are not contradicted by the most recent developments in bank credit analysed in this post.
This post was jointly written by Steve Donzé of Pictet Asset Management and Francesco Papadia, with the assistance of Madalina Norocea.
- Assessing the assessment [↩]
- The standard deviation of annualized growth rate of loans stood at 2.5 % for households and at 6.5% for non financial firms between January 2007 and January 2015.[↩]

Dear Mr .Papadia
I agree with you, let me add that the cost of liabilities for Spanish banking, shows a terrific improvement
and nowadays the average interest rate paid in new operations in household and non financial corporations in Spanish Banks is clearly below the Euro area average even a bit lower than in Germany.
These big improvement, due to the fantastic job done by ECB with its , and the big restructuring process in banking sector in Spain has produced a extraordinary plainfield in financial conditions for many months and will produce a jump in activity above 3% growth this year.
ECB with QE, negative interest rates, TLTRO, ESM,SSM, adding flexibility to economy with reforms are all in the right direction and we will get the success of the Euro Area sooner than later.
Kind Regards
Jaime
Dear Mr. Communión,
many thanks for your comment.
From the vantage point of Spain, you are depicting an even more favourable description than we documented for the €-area.
While things are moving in the right direction, what I think still needs to be done is more determined action in the structural area, to increase the medium and long term growth of the €-area, lest we get out of the crisis but remain in a long term stagnation.
I hope you are doing fine
Best regards
Francesco