Can Italy maintain the €? Yes, if it grows, unlike in the last 17 years.
Many inconsistent trios go around the world. Possibly the most famous is the one popularized, among others, by Tommaso Padoa-Schioppa 1 , whereby only any two of the three following components are mutually consistent: free capital movements, fixed exchange rates and autonomous national monetary policy. Another inconsistent trio that acquired great relevance in assessing the current wave of populism is the one put forward by Dani Rodrik 2 : the world can only choose two out of the trio composed of hyper-globalization, democratic politics, national sovereignty. In a way Rodrik developed the intuition of Kindleberger, who noted that the growingly global action of private actors, opposed to the prevailing national approach of public authorities, has created a dearth of international public goods, such as global regulation, engendering clear risks for the world economy.
In this post I want to put forward my own incompatible trio. Padoa-Schioppa`s trio applied to the European Union, Rodrik`s to the global scene, mine, more modestly, just to Italy.
Basically my argument is that 130 per cent for the debt to GDP ratio, the € and continued stagnation in economic growth (as recorded on average over the last 17 years) form a not compatible trio in the long run.
I think it is wrong to present the issue as one of impending urgency: Italy is not about to leave the € and return to the disgraceful inflation-devaluation economic model that characterized the lira between the abandonment of the Bretton-Woods parity in the first half of the 1970s and the prospect of joining a stable € in the second half of the 1990s.
I think, however, it is equally wrong to assume that Italy can continue stagnate and not experience tensions between its participation in the € area and the service of its debt: if Italy would not grow in the next decade, as it did not do over the last 17 years, the trio would indeed turn out to be incompatible. This is not an outcome likely enough to make it the baseline of any projection, but not unlikely enough to be considered just irrelevant.
The steps I will follow in making my point are the following:
- Italian growth performance has been miserable for the last 17 years,
- Sustainability Analyses show Italy`s fragile situation. One crucial factor determining sustainability is the rate of real growth,
- Italy has a dismal record when it comes to economic flexibility and competitiveness,
- There are numerous cases in the €-area of countries that managed to improve their economic performance, achieving an acceleration of growth analogous to the one Italy would need to bring its debt sustainability in a safe zone,
- Seen in the long term time horizon on which this post concentrates, the continuous begging by the Italian government for fiscal flexibility from European authorities is, at best, irrelevant, at worst confusing,
- In launching a program of structural innovation, Italy should concentrate on those measures that bring higher growth over relatively short time spans so that the market sees improving sustainability and the electorate improving living conditions.
I.Italian growth performance has been miserable for the last 17 years.
Figure 1 shows that Italy´s real GDP is at the same level of 2000, so Italy recorded on average no growth over the last 17 years. There are, however, two growth phases: a period of decent growth between 2000 and 2007 and then the large losses since 2008. The IMF then forecasts some growth for the second half of the 2010s.
Figure 1. Italy`s real income
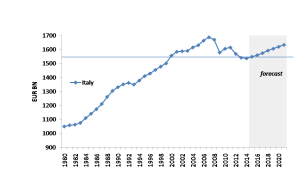
Source: IMF WEO.
Another measure of Italy`s dismal growth performance in recent years is that its GDP is nearly 8 per cent below its level in 2007, so Italy is the country that has lost more GDP during the Great Recession after Greece (-26 per cent) and is one of the only 7 countries out of 19 in the €-area that did not manage to recover as yet the losses recorded during the Great Recession.
What adds to the worry is that Italy, contrary to normal long term developments, produces less output now than it produced, with similar input of labour and capital, before the Great Recession, as shown by the fact that Total Factor Productivity has come down on average since the beginning of the 2000s, as documented in Figure 2.
Figure 2. Growth of Total Factor Productivity in Italy. 1995-2015.
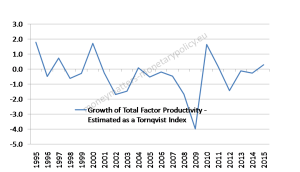
Source : Total Economy Database.
II.Sustainability Analyses show Italy`s fragile situation. One crucial factor determining sustainability is the rate of real growth.
Two main facts emerge looking at different debt sustainability analyses applied to Italy:
- Italy´s debt should be sustainable, but this conclusion is fragile,
- Among the parameters determining sustainability, the growth of real income plays a crucial role.
The sustainability, but also the fragility, of Italy´s DSA is shown in the most accurate DSA I am aware of, the one carried out by Cline in 2012 and then updated in 2014 3. His exercise has the advantage of considering debt sustainability in an explicit probabilistic setting, in which joint probabilities of events are considered, providing a whole distribution of results, thus moving beyond the too coarse Sustainable/Not Sustainable alternative. His baseline conclusion is that Italian debt should be sustainable, but a look at his assumptions shows the difficulty of setting them as well as the risk for sustainability coming from less favourable assumptions. For instance, for the first 4 years of Cline´s 2014 simulation (2013 to 2016) Table 1 reports his baseline critical parameters as well as the actual data, reported in bold 4. The table also reports Cline`s assumptions for 2017 and 2020, the final year in his simulation and, underlined, European Commission forecasts. The effective interest rates are drawn from an IMF publication.
Table 1. Cline´s critical Italy DSA parameters and actual data. 2013-2016.
| 2013 | 2014 | 2015 | 2016 | 2017 | 2020 | |
| Real Growth-% | -1.8 -1.9 | 0.7 -0.3 | 1.1 0.8 | 1.4 1.1 | 1.4 1.3 | 1.2 1.4* |
| Primary Surplus- % of GDP | 2.0 1.9 | 3.3 1.6 | 3.6 1.6 | 4.5 1.7 | 5.1 2.8 | 4.6 3.6* |
| Interest Rate-% | 4.2 | 4.4 3.6 | 5.6 3.2 | 5.7 3.1 | 5.6 | 5.6 |
Source: Tables 6.1 and 6.4 of W. R. Cline, Managing the Euro Area Crisis, Peterson Institute for International Economics, June 2014.Table 2 of Assessment of the 2016 Stability Programme for Italy, European Commission, Directorate General Economic And Financial Affairs, 26 May 2016. IMF, Article IV consultation (2016, page 46-54).
*= figures for 2019.
The most obvious differences between Cline`s assumptions and actual data relate to the interest rate, much more favourable, and the primary surplus, much less favourable. Actual developments of the primary surplus, as well as of the debt to GDP ratio, are much closer to his negative scenario than to his baseline. Growth was also somewhat lower than assumed by Cline. Overall, Cline`s assumptions were too optimistic, since the debt to GDP ratio has not started its downward trend in 2013, as in Cline`s central expectation.
Eichengreen and Panizza (2014) 5 show that, historically, large and sustained primary surpluses are rare, so one should not assume in DSAs that a country can maintain very high surpluses for very long. Specifically they establish that the maintenance of a surplus of 5 per cent for 10 years is a very rare event, while a surplus of at least 3 per cent is uncommon but not rare, covering 11 per cent of the 113 ten-year episodes in their sample. They also notice that, not surprisingly, high primary surpluses are more likely when real growth and the debt to GDP ratio are high. The latter effect comes from the greater political and economic pressure to reduce debt when this is high. In particular, for a country like Italy, with a debt to GDP ratio of about 130 per cent, there would be the probability of about one third, according to these authors, to maintain a surplus of 3 per cent or more for 5 years.
However, even taking into account the favourable effect of high debt on the primary surplus, Eichengreen and Panizza conclude, consistently with the evidence in table 1, that the 6.6 per cent primary surplus that Italy should maintain to reach a debt to GDP ratio of 60 per cent in 2030 is utterly unrealistic, even under very favourable scenarios. But this tells more about the lack of realism of the objective than about debt sustainability: the latter just requires the debt to GDP ratio to be on a significantly downward trend. 6
The IMF 7 carried out its DSA in 2016, with real GDP growth ranging between 0.8 and 1.3 per cent and effective interest rate around 3.0 per cent in the 2016-2021 period. Also sizeable primary surpluses of 3.5-4.5 % of GDP were expected. With these assumptions, the Italian debt to GDP ratio would decrease very gradually. However, the IMF also considered the case of real growth rates lower by one standard deviation for two years starting in 2017, resulting in an average growth of –1.1 per cent in 2017–2018. Furthermore, for every 1 percentage point decline in growth, inflation is assumed to decline by 25 bps. With this negative shock, the primary balance improves more slowly than in the baseline, reaching only 1 per cent of GDP by 2021 while debt increases rapidly to about 144 per cent of GDP and then fails to come down over the projection period.
None of the DSAs mentioned above includes a scenario in which Italy would not grow at all, as it did not grow, on average, over the last 17 years: in the DSAs considered above, growth is indeed expected to stabilize somewhat higher than 1 per cent.
To assess whether with no growth Italy`s debt would be sustainable, a fully-fledged DSA, similar to that of Cline, would be needed with updated assumptions. In the light of actual developments and of the findings of Eichengreen and Panizza, the lower surplus of 2.7 per cent, assumed in Cline´s unfavourable scenario, looks much more likely than the baseline scenario of 4.6 per cent. On the interest rate, instead, Cline`s 5.7 per cent assumption for 2016, which would only go down to 5.6 per cent in subsequent years, looks too pessimistic, and the 3 per cent prevailing in 2016 looks now more reasonable.
Short of carrying out a fully fledged DSA, one can work out a sense of the Italian debt to GDP ratio trajectory starting from the formula according to which the change in the debt to GDP ratio is equal to the current debt to GDP ratio multiplied by the difference between the nominal interest rate and the growth of nominal GDP, i.e.
∆(B/Y)=B/Y(r-∆Y)- P/Y
Where B is public debt, Y is nominal income, r is the nominal interest rate and P is the primary surplus.
Assuming, according to what is mentioned above:
B/Y=133 per cent
r= 3 per cent
P= 2.7 per cent
P/Y= 1.5 per cent, because of zero real growth and partial success of the ECB in keeping inflation close to its objective of 2 per cent,
we have ∆(B/Y)= -0.7 and thus a gently declining debt to GDP ratio. But it is enough for the nominal interest rate to grow above a non-implausible 3.5 per cent for the debt to GDP ratio to climb onto a growing, potentially unsustainable, trajectory. To move away from the dangerous zone in which a small increase of interest rates makes the debt unsustainable, an average growth of between 0.5 and 1.0 per cent, rather than 0, would be needed.
III. Italy has a dismal record when it comes to economic flexibility and competitiveness.
A fact that receives scant attention in Italy is that the country has a dismal record when it comes to economic flexibility and competitiveness.
In a post I published on April 29 2014 8, I presented OECD indicators showing that Italy had done significantly less than Greece and Portugal in carrying out structural innovations to its labour and product market between 2008 and 2013.
The World Bank provides more recent evidence in its “Ease of doing business”, as reported by the ECB in Chart A below. Italy occupies a lacklustre 50th position at global level and is fourth from the bottom in the €-area. In addition, the chart shows that, after some improvement in the initial phase of the Great Recession (2008-2013), Italy has not managed to improve its indicator in 2013-2016.

Source: The chart is drawn from the ECB Economic Bulletin article of 8/2016, On Structural Indicators of the euro area business environment.
In terms of Global Competitiveness Index, always according to the World Bank, Italy is 7th from the bottom in the €-area and 44th from the top at world level, having recorded little improvement between 2008 and 2016.
IV. There are numerous cases in the €-area of countries that managed to improve their economic performance, achieving an acceleration of growth exceeding the one Italy would need to make its debt fully sustainable.
Table 2 reports the growth rate of €-area countries in non-overlapping 5 year periods, since 1981. The cases in which one country accelerated its growth from one 5-year period to the following one by more than 1.5 per cent are highlighted in green.
Table 2. Five-year Periods in which a country accelerated its growth by more than 1.5 per cent.*
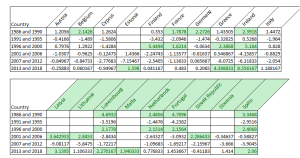
Source: IMF WEO
* includes IMF forecasts for 2017 and 2018.
There are 26 such cases, corresponding to nearly one third of the 94 cases in the sample. Thus cases of an acceleration of growth by 1.5 per cent are by no means unusual. For a lower threshold of acceleration of 1 per cent, the cases grow to 36, i.e. 38 per cent of the total.
The conclusion of this simple statistical exercise is that achieving an acceleration of growth of 1.5, and even more 1.0 per cent, does not require heroic efforts.
V.Seen in the long term time horizon on which this post concentrates, the continuous begging by the Italian government for fiscal flexibility from European authorities is, at best irrelevant, at worst confusing.
Even a cursory look at Italian newspapers, and even at Italian economists discussions, gives the impression that the reason why Italy has such dismal economic performance is because of the EU imposed austerity. Indeed the issue is often made personal and Chancellor Merkel and Finance Minister Schäuble are often indicated as the culprits. Daniel Gros 9 rightly stressed, instead, that the solution to Italian problems is to be found in Rome rather than Berlin, or Brussels. Of course, this does not absolve the German Government from continuing to accept an embarrassingly large current account surplus, which the EU Commission is not capable of disciplining. Neither does it justify the ideological view that seems to prevail in the German Finance Ministry, according to which there can never be a case of insufficient aggregate demand, in a caricature replica of Say`s law. But these considerations do not affect the conclusion that it is not because of fiscal austerity that Italy has not grown, on average, for nearly two decades. Indeed, I know no economic model or theory that can explain such a long stagnation with fiscal causes. Even a model with hysteresis, whereby insufficient demand can have persistent effects, cannot be stretched to explain decades of no growth. In addition Germany, the arch supporter of austerity – more for others than for itself it must be admitted – has a budget surplus and quite satisfactory growth in full employment conditions, contrary to the view that austerity inevitably leads to low growth.
I am also unaware of a model that can explain a long stagnation like Italy`s with monetary reasons. In particular I find it hard to believe that the cause of Italy´s no growth is the adoption of the €. In addition this explanation does not fit the facts: as noted above, between the adoption of the € in 1999 and the beginning of the Great Recession in 2007 Italy grew at a lacklustre but not abysmal rate of 1.5 per cent. Time wise it is the Great Recession not the € that affected Italian growth. But this is another story, to which I may dedicate a future post. 10
A look to the contribution of different items to domestic demand in Italy, in figure 3, confirms the obvious fact that it is private consumption and, to a lesser extent, investment rather than public consumption constrained by austerity that dominate changes in domestic demand.
Figure 3. Italy, contribution to domestic demand (% of GDP).
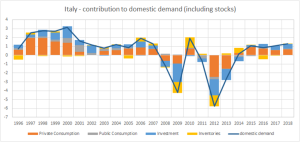
Source: AMECO database.
In the long term perspective taken in this post, the continuous begging by the Italian government of fiscal flexibility from European authorities looks at best futile: the real issue is not to be able to increase public deficit to stimulate demand. At worst, the insistence on fiscal policy is damaging, as it distracts from the real problem: the poor supply performance of the Italian economy.
VI. In launching a program of structural innovation, Italy should concentrate its attention on those measures that bring higher growth over relatively short time spans so that the market sees improving sustainability and the electorate improving living conditions.
The solution to Italy´s stagnation looks, to me, obvious: a robust program of structural innovation, improving the supply side of the economy, bringing about the increase of Total Factor Productivity that has been missing in Italy for very long 11.
However, a general invoking of structural measures is too generic. A. Terzi 12, discussing the Greek adjustment programs, convincingly argues that not all structural measures have the same effect on growth over the same time horizon. In particular he reports research to show that product and labour market reforms produce positive growth effects well before institutional reforms and that the combination of labour and product market reform produces the highest growth effects over the shortest possible time horizon. Institutional reforms, such as improving public administration, streamlining the budgeting procedure and increasing fiscal transparency are of course also important, but deliver growth results only in the long run.
The IMF in Chapter 3 of its April 2016 World Economic Outlook shows that product market reforms are the quickest in delivering activity and employment gains and do so under all circumstances, unlike labour market reforms, in particular those reducing employment protection and unemployment systems, that may have negative short term effects in period of slack in growth. The strong policy message from the IMF analysis is that sequencing the different types of structural measures is crucial.
Anderson 13 and al. report the quantitative growth effects of a gradual implementation over 5 years of the structural reforms in the product market that the OECD has recommended for euro-area countries in its “Going for Growth” initiative 14. The growth effect of the structural measures is higher for peripheral countries, which are further away from the optimal frontier, than for the core countries. For peripheral countries the implementation of product market reforms can increase real GDP by between 2.5 and 6.5 per cent over a 10 year horizon, meaning some 0.25 to 0.65 per cent higher growth on average per year. Anderson and al. also estimate the growth effect of labour market reforms, implemented in the first year of the simulation. These are much lower than for product market reforms, amounting to a range between 1.25 and 2.5 per cent after ten years, meaning a yearly average acceleration of between 0.12 and 0.25 per cent per year. Summing up the two effects, overlooking the positive interactions mentioned by Terzi, would increase yearly growth by between 0.37 and 0.90 per cent.
The ability of structural measures to improve growth over the medium term is also recognized in the G20 statement of November 2014: “the leaders of G20 countries agreed to “ambitious but realistic” policies with the aim to lift the G20’s collective GDP by at least 2% above the trajectory implied by the existing policies over the coming five years. All G20 countries submitted Growth Strategies (GS) that consist of macroeconomic policies to stimulate demand in the near term and structural reforms to lift employment and productivity through stronger competition, trade, as well as public and private investment.” The average acceleration of growth planned by the G20 is, at 0.4 per cent per annum on average over a five-year horizon, at the low end of the estimated range provided by Anderson and al.
In any case, a higher growth in a range between 0.4 and 0.9 roughly correspond to the growth improvement that Italy needs from the 0 record of the last 17 years to safely reduce its debt to GDP ratio going forward and thus assuring debt sustainability.
A lazy remark would be that 0.8 per cent is about the current rate of growth in Italy and that the DSAs reported above even project a better performance, somewhat higher than 1 per cent, for the foreseeable future. In light of this observation, one could conclude that Italy does not need to do anything more than just continue growing like in the last 2 years. This would, however, be not only a lazy but also a dangerous conclusion. It is not at all obvious that the current rate of growth is a better estimate of the long-term future growth of Italy than its experience over the last 17 years. In order not to fall under the curse of the incompatible trio between stagnation, the € and the high debt to GDP ratio, Italy needs an assurance that it will not fall back in the stagnation that has prevailed since the beginning of this century. Only a robust program of appropriate structural measures can provide such assurance.
In conclusion, the debt sustainability of Italy is not beyond doubt. In particular it would be at risk if Italy would replicate in the foreseeable future what it did over most of the past two decades: not growing. An acceleration of growth, bringing the sustainability of Italian debt in a safe region, would not require any extraordinary performance, a number of €-area countries have done something comparable in the last decades. Since Italy is characterized by poor flexibility and competition in both product and labour markets, the growth bonus that could be brought by a robust, well-targeted and sequenced program of structural measures could be significant and capable of bringing Italy´s debt onto a safer territory.
The incompatibility of the trio between no growth, the € and a high debt to GDP ratio is not a short-term risk, but is nonetheless important enough to deserve forceful policy action. Should this not be forthcoming over a reasonable period, the first manifestation of the inconsistency, before really putting debt sustainability or the € at risk, would be the crossing of the Alps not by Hannibal but by the troika 15, imposing the changes that Italy seems unable to implement on its own. The infamous “vincolo esterno”, whereby Italians need external pressure to do things to their own advantage, would reappear, uninvited and unwelcome.
This post was prepared with the assistance of Pia Hüttl and Madalina Norocea. William Cline, Maria Demertzis, Daniel Gros, Andrè Sapir and Claudio Conigliani provided some very useful comments.
- T. Padoa-Schioppa also presented an incompatible quartet, where trade freedom was the fourth participant: Squaring the circle, or the Conundrum of International Monetary Reform, in Catalyst, N.1.[↩]
- D. Rodrik, Sense and Nonsense in the Globalization Debate. Foreign Policy, No. 107. (Summer, 1997), pp. 19-37.The Globalization Paradox, Dani Rodrik, December 2011.[↩]
- W. R. Cline, Peterson Institute, Working Paper Series 12-12, August 2012. Sovereign Debt Sustainability in Italy and Spain. A Probabilistic Approach. W. R. Cline, Managing the Euro Area Crisis, Peterson Institute for International Economics, June 2014.[↩]
- Cline has also assumptions about non-recurrent expenses and revenue, e.g bank bailing-ins and privatizations. Any figure relating to these items is, however, too small to have a systemic impact on a long term DSA. It should be noted that the parameters reported in the table as drawn from the 2014 book are quite different from those used in the 2012 article, further showing the difficulty of setting these parameters.[↩]
- B. Eichengreen and U. Panizza, NBER Working Paper No. 20316 Issued in July 2014 NBER Program(s): A Surplus of Ambition: Can Europe Rely on Large Primary Surpluses to Solve its Debt Problem? [↩]
- For instance, Alesina, Perotti and Tavares (1998) use a sample of 19 OECD countries in 1960-95 and define fiscal adjustment as “successful” if in a year the primary deficit-to-GDP ratio falls by at least 1.5 percentage points and then is on average at least 2 percentage points below its initial level for three subsequent years, or the debt-to-GDP ratio is at least 5 percentage points below its initial level three years after the adjustment.[↩]
- IMF article IV consultation (2016, page 46-54).[↩]
- Titus Maccius Plautus and the European Troika. [↩]
- Can Germany save Italy? CEPS Commentary, 2 December 2016. [↩]
- Maria Demertzis, Kostantinos Efstathiou and Fabio Matera in The Italian Lira: the exchange rate and employment in the ERM, convincingly make the point that the repeated devaluations of the lira before this was substituted by the € did not help employment in Italy. Bruegel Blog Post January 13th 2017.[↩]
- Daniel Gros, in What is holding Italy back? CEPS Commentary, 8 November 2011, has a more pessimistic view, according to which Italy´s problems lie deeper, in poor governance, as manifested by deteriorating corruption control, rule of law and government effectiveness. This view deserves more attention than what is possible in this post. [↩]
- A. Terzi, Reform Momentum And Its Impact On Greek Growth, Bruegel Policy Contribution, July 2015. [↩]
- Fiscal consolidation in the euro area: How much pain can structural reforms ease? Derek Anderson, Benjamin Hunt and Stephen Sudden. Journal of Policy Modeling, Vol. 3, Issue 5, September-October 2014.[↩]
- As summarised by Anderson and al. „Product market reforms aim at reducing anti-competitive product market regulations. Labor market reforms are more varied, and include reducing barriers to entry into professions, reducing employment protection legislation, reducing unemployment benefits, increasing the standard retirement age, reducing the opportunity cost of continued employment between the ages of 60 and 65, increasing childcare support, and implementing active labor market programs.”[↩]
- The prospect of the troika coming to Italy was suggested to me in a private conversation with Claudio Conigliani.[↩]
