Secular Stagnation vs. debt Super-cycle: which one is right ?
Abstract: Advanced economies, the €-area in particular, are struggling with mediocre growth and too low inflation, notwithstanding valiant central bank action. Various hypotheses have been provided to explain this contrast. One important difference between them is the time horizon over which low growth and too low inflation will prevail: are we confronted with a cyclical phenomenon, which will eventually give way to normalization, or to a persistent state of affairs? In the latter case, central banks will continue to bump into the lowest interest rate bound and will thus need to maintain “unconventional measures” in their panoply for an undefined period of time. The pattern of inflation and growth since the beginning of the Great Recession does not show a clear “hit and recovery” pattern implicit in a cyclical crisis, but neither does it provide definite evidence in favour of the Secular Stagnation hypothesis. This latter hypothesis finds, however, some support in the fact that interest rates, both short-term and long-term, are at their lowest level, as far as we can see, in the history of humanity and are expected by the market to remain depressed for the next few decades. Reluctantly, I am forced to change the prior with which I started my analysis: my working hypothesis now is that we will see, in the Eurozone, a prolonged period of low growth, low inflation and low interest rates rather than a gradual return to normality. We thus risk seeing “unconventional” monetary policy measures becoming quite conventional and bond market remaining in a depressed state going forward in Europe.
1. Secular Stagnation Redux
In December of 1938, Alvin Hansen[1] delivered a Presidential Address at the 51st meeting of the American Economic Association on Economic Progress and Declining Population Growth. In his speech Hansen advanced the hypothesis that the American economy could enter a period of “secular stagnation”.
In essence, his argument was that three fundamental factors had sustained investment until the first decades of the twentieth century: demographic growth, new territories (the Wild West in the US, the colonies elsewhere), resources and technical progress. The first two of these factors were no longer there to support investment and the third might not be sufficient to support levels of investment compatible with full employment.
Whether Hansen was wrong depends on the interpretation one gives to his address.
If it was a conditional forecast, thus depending on the realization of some events, one should observe that the events he conditioned his forecast on, simply did not take place. If it was an absolute forecast, however, he was wrong, as the decades after World War II were actually characterized by high growth. In Western Europe, growth was rapid and sustained in a manner not seen before or since; so much so that this period is now known as the Golden Age of European Economic growth. Also other parts of the world saw their economies expand. Trade liberalization, technological transfer and the absence of major financial crisis fuelled growth. The US was the economy on the technological frontier in this period, but the communist block and even many countries in Africa and Latin America made significant strides towards higher living standards.
Whatever interpretation one chooses, Larry Summers was brave enough to resuscitate, nearly 80 years later, the secular stagnation hypothesis. He advanced the idea that we are confronted with a period of insufficient demand going on indefinitely into the future, mostly because of too low investment, requiring fiscal stimulus to avoid long lasting unemployment.
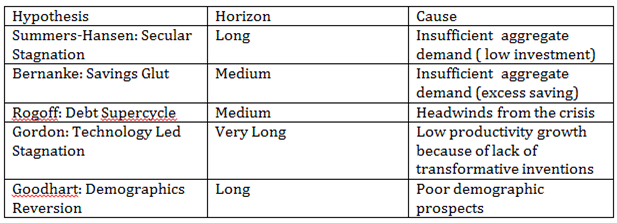
The Hansen-Summers Secular Stagnation hypothesis is just one of five distinct hypotheses postulating a period of low growth in the medium or long term. The others are: the Savings Glut of Ben Bernanke, the Debt Supercycle of Kenneth Rogoff, the Technology Led Stagnation of Robert Gordon[2] and the Demographic Reversion of Charles Goodhart. Table 1 summarizes the similarities and differences between the five hypotheses.
Table 1. Secular Stagnation, Savings Glut, Debt Supercycle, Productivity Led Stagnation and Demographics Reversion.
Bernanke`s savings glut is also characterized by insufficient aggregate demand, but differs from Summers-Hansen’s hypothesis because profitable investment opportunities should materialize once interest rates have gone low enough. In addition, this interpretation gives more importance to an excess of savings outside of the United States, and in particular in Emerging Economies, than to investment as an explanation of very low interest rates and anaemic growth.
Rogoff rejects the idea of a secular stagnation. Instead, the author postulates “a debt supercycle [hypothesis] where, after deleveraging and borrowing headwinds subside, expected growth trends might prove higher than simple extrapolations of recent performance might suggest.”
Gordon is probably the most radical in terms of forecast horizon. He identifies the high productivity growth century comprised between 1870 and 1970 as quite unique in the history of humanity. Thus, in his view, stagnation originates from the aggregate supply side, possibly as a permanent feature.
The main point of Goodhart and co-authors is that the reversion from a “demographic sweet spot”, which started around 1970, to the current poor demographic prospects will bring about a couple of decades of low growth. The demographic reversion will also cause an increase of wages and a move towards less income inequality.
This essay[3] has nothing to say about the Gordon hypothesis, as I do not dare to make technological forecasts, and conflates the Rogoff and Bernanke interpretations into a “Headwinds Hypothesis”, with a medium term horizon, opposed to the fully fledged “Secular Stagnation” hypothesis of Summers, with a long horizon. Basically, the reductionist approach I follow in this paper is to try and harness information about the likely length of the period of low growth ahead of us: “Medium Term”, as in the Headwinds Hypothesis, or “Long Term”, as in the Secular Stagnation? In following this approach, I assume that low growth will continue to be accompanied by low inflation and low interest rates. The intuitive link between low growth, on one hand, and low inflation and interest rates, on the other hand, is not considered by Goodhart as persisting in the future: while keeping growth low, negative demographic trends will, over time, increase nominal and real interest rates. The absence of a direct link between growth, on one hand, and interest rates, on the other hand, makes this essay irrelevant for assessing the validity of the complex predictions of Goodhart about the long-term effects of the demographics reversion.
2. The secular stagnation hypothesis was thought for the US but is more relevant for the euro-area
Most of the authors mentioned in the previous section had the American economy in mind when developing their hypotheses. This conclusion is qualified, but not contradicted, by the fact that Bernanke´s “Savings Glut” approach was intrinsically global and Summers, in a rejoinder to Bernanke, accepted the need to take a global perspective and even concluded that: “… the greater tendency towards deflation, and inferior output performance in Europe and Japan suggests that the spectre of secular stagnation is greater for them than for the United States.”[4] This conclusion is shared by De Grauwe: “Nowhere in the developed world is secular stagnation more visible than in the Eurozone.“[5] The idea that secular stagnation is a more concrete risk for Europe (and Japan) than for the United States also emerges from a blog post by Wolff[6] and the entire workshop organized at Bruegel in October 2015. The agenda for many observers and commentators in Europe appears to be focused on how to prevent this impending calamity from materializing.
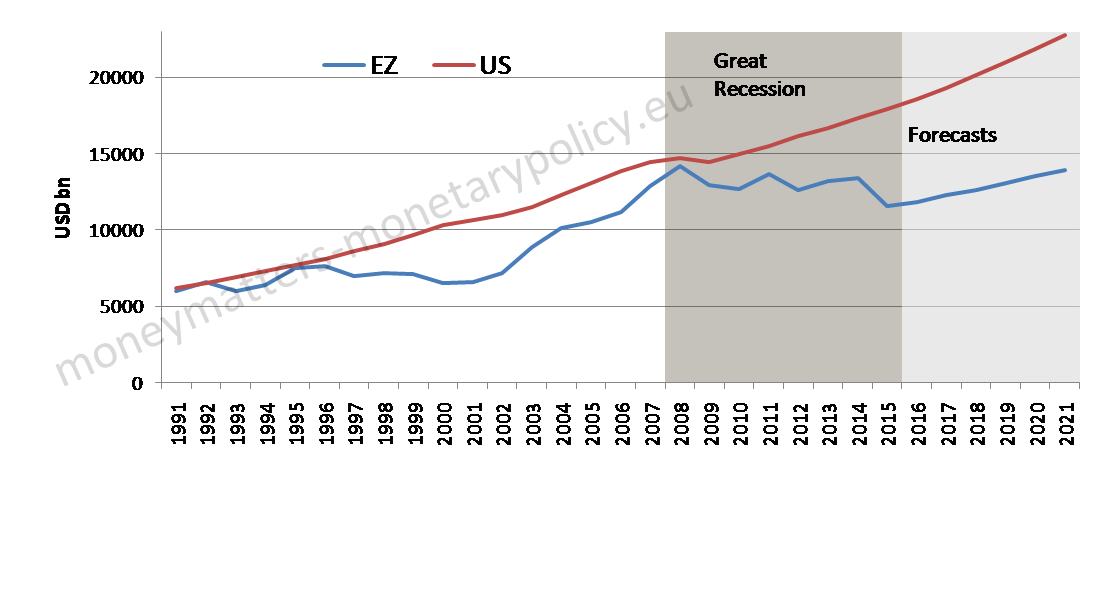
The pessimistic view of many on Europe is not hard to justify. The European, and in particular the €-area, economy has been weaker than the American one for a number of years. As shown in Figure 1, €-area GDP was about at the same level as US GDP in 1991 and again in 2008, but in the following 8 years of Great Recession €-area GDP has stagnated, while the nominal GDP of the US has regained a pace of growth similar to the one prevailing before the crisis.
Figure 1. US and €-area level of nominal GDP, 1991-2021.
 Legend: The darker shaded area denotes the Great Recession, the lighter shaded area denotes forecasts.
Source: IMF WEO
The divergence between the US and the Euro zone is also likely to continue into the future. Available IMF forecasts indicate that US GDP will continue to grow well beyond the pre-crisis level. In the €-area, instead, one may have to wait until the first years of the next decade for nominal GDP to regain the pre-crisis level in dollar terms.
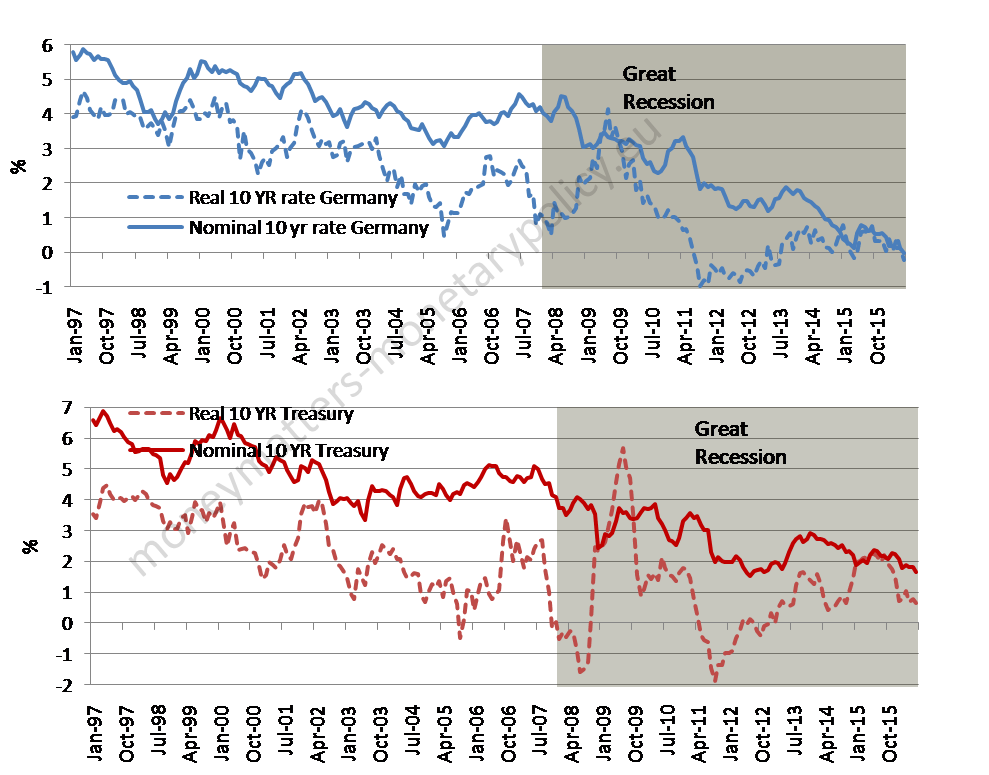
Figure 2. Bund and Treasury 10 year nominal and real yields, 1997-2016.
Source: ECB SDW and US Treasury.
A similar story is told by nominal and real sovereign yields in Germany, taken as the €-area benchmark, and in the US. Figure 2 shows that in both economies nominal and real yields have come down over the last two decades, but the fall has been larger in Germany, where nominal yields have reached zero, and even entered negative territory, while they remained at around 1-2 per cent in the US.
3. The monetary policy consequences of the Secular Stagnation and of the Headwinds hypotheses are very different
In the Wicksellian approach, which dominates monetary policy in both academic and policy circles, the key relationship is the one between the “natural rate of interest”, which can, to a first approximation, be equated to the potential growth of the economy, and the “monetary-rate”, fixed by the central bank. The natural rate and the monetary rate are also the main characters in both the Secular Stagnation and the Headwinds hypotheses.
When the monetary rate is higher than the natural rate, there is monetary restriction and deflation; easing prevails, instead, when the monetary rate is lower than the natural one. Of course, the same logic applies to the Taylor rule, which can be taken as a somewhat more detailed formulation of the Wicksell rule, even if there is no trace of this ascendency in the original Taylor article[7].
Indeed, rearranging the usual formulation of the Taylor rule, we can immediately observe that the difference between the natural and the monetary rate determines the rate of inflation, for a given deviation of income from potential.
r – 4 = 0.5y + 1.5 (π -2)
where:
r is the monetary rate, fixed by the central bank;
y is the percent deviation of real GDP from potential;
π is the current rate of inflation;
2 is the desired level of the inflation rate;
4 is the assumed level of the nominal natural rate.
There is, however, a significant difference between the original Wicksellian and the Taylor approach. In Wicksell’s formulation, the variability of the natural rate is assumed higher than that of the monetary rate. The most common dynamic process, in Wicksell´s view, is that the natural rate changes and leads to changes in inflation, in turn bringing about a gradual change of the monetary rate. Instead, the most common interpretation of the Taylor rule attributes more variability to the monetary rate than to the natural rate, often assumed to be simply constant. As I will show below, it is Wicksell´s original view of a variable natural rate that is currently dominating the monetary policy debate.
The Secular Stagnation and the Headwinds hypotheses, presented in section 1, have two different, but related, important implications for monetary policy:
• The normalization of rates from the current very low level should be slower and less extended if the Secular Stagnation rather than the Headwinds hypothesis prevails,
• The risk of hitting the zero lower bound repeatedly is higher if the Secular Stagnation is correct and therefore there may be continued need to resort to unconventional measures.
It is worth its while to examine these two points a little further.
The issue of a normalization of rates has arisen, for the time being, only for the FED: if anything, the ECB is still in an expansionary phase. Overall, the FED has significantly lowered the pace of its normalization over the last couple of years. One important aspect of this lower pace was the reduction of the projection for R* [8], which one can interpret as the FED’s nominal version of the Wicksellian natural rate: Bernanke[9] illustrates that this was reduced by 1.25 per cent, from 4.25 to 3.0 per cent, over the 4 years between 2012 and 2016[10]. There are two opposing interpretations for the gradualism in this reduction. First, in a fully fledged Secular Stagnation approach, the slow pace of reduction of R* by the FED is the result of intellectual inertia: the FED was simply slow in understanding that the natural rate had come down and will remain low for the foreseeable future[11]. Second, if one accepts the Headwinds theory, instead, the FED was justified in reducing R* only cautiously, since it is not clear for how long will the natural rate stay so low.
At the ECB there is some clear support for the view that the natural rate is low and expected to remain low. If one judges the ECB`s actions with the Secular Stagnation hypothesis in mind, it is just adapting its rate to the low natural rate, not forcing rates lower. The clearest recent example of this approach is to be found in a speech by the ECB Board Member, B. Coeure[12]: “We face an exceptional situation where the real equilibrium rate is very low,” and “We may see short-term rates being pushed to the effective lower bound more frequently in the event of macroeconomic shocks.” However, innate central bank prudence as well as different views between doves and hawks in the Governing Council have so far prevented the ECB from issuing a clear indication whether they think they are pushing rates lower or just passively adapting to a low natural rate. In addition, there is a potential contradiction between the repeated statements from the ECB that QE is effective in reducing yields and the idea that it is fundamental factors rather than central bank action that is lowering rates.
As regards the second point mentioned above, i.e. the risk of continuing to hit the zero lower bound, one big innovation in the conduct of monetary policy during the Great Recession has been the intense use of the size of the balance sheet as a new monetary policy tool. Whether the Secular Stagnation or the Headwinds hypothesis will prevail will determine whether balance sheet management will remain a persistent feature of monetary policy or just an isolated episode, however important. Should the Secular Stagnation hypothesis prove to be wrong, central banks will likely go back to using just the interest rate as the dominant monetary policy tool. If the Secular Stagnation hypothesis will turn out to be correct, instead, the risk of repeatedly hitting the lower zero bound will persist, as will the need to continue using the balance sheet to impart additional monetary stimulus when nothing more can be done on the interest rates side. In this perspective, it will no longer possible to talk about unconventional measures, as they will become a persistent, maybe even permanent, feature of central bank action.
4. Patterns of growth and inflation as discriminating factors
Given the different monetary policy consequences of the Secular Stagnation and the Headwinds hypotheses, it is important to discriminate between them. This and the following paragraph engage into this exercise.
In essence, the two hypotheses differ in terms of the pattern over time of growth, inflation and interest rates. The Headwinds interpretation sees the current situation as the long-drawn, but temporary aftermath of a particularly serious crisis. The reference to the cycle in Rogoff`s terminology is a clear indication of the intellectual ascendency of this interpretation: Minsky, Kindleberger-Aliber and, of course, Reinhart and Rogoff. The Secular Stagnation interpretation posits, instead, that we have moved onto a permanent, lower-growth, lower inflation and lower interest rates plateau.
Of course, which pattern better describes the behaviour of the economy will only be known ex-post, with the benefit of hindsight. At that time, however, we will be much less interested in the answer: the usual trade-off applies, we have better answers for the less interesting questions. What we can do right now is to analyse the patterns of inflation, growth and interest rates. The first two variables will be looked at in this paragraph, the interest rate in the following one. The question is the same in the two paragraphs: do we see economies hit by a shock and then slowly recovering? Or do we see a permanent downward shift?
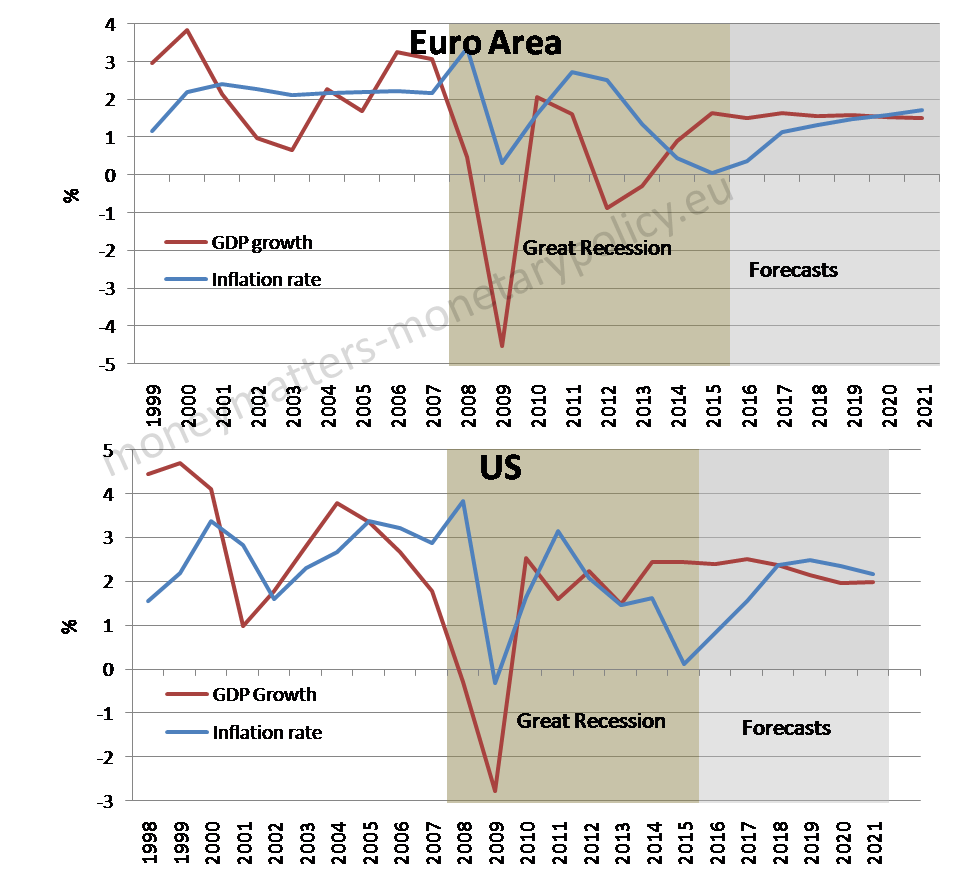
Figure 3. Patterns of growth and inflation in the US and the €-area, 1999-2021.
Source: IMF WEO.
The reading of figure 3 is suggestive but not really conclusive. Taking the forecasts literally, both economies should move, by the beginning of the next decade, towards a 2-2 pattern: 2 per cent growth and 2 per cent inflation. The US should stabilize just above 2 per cent while the €-area should remain somewhat below. Overall, for both countries the rate of growth and inflation should be a little lower than pre-crisis. But these forecasts could simply be the result of the “reversion to the mean” property that is so strong in most macroeconomic models. The limitations of this type of forecasting have been demonstrated by the repeated overshooting of growth forecasts for the Euro area since the beginning of the crisis.
The story is different if we only consider actual data: inflation and growth do not yet clearly show either a gradual recovery towards pre-crisis levels or a new, lower plateau. More fundamentally, we should consider that, 9 years after the beginning of the crisis, the monetary accelerator is currently still being pushed to the extreme, particularly in the €-area, and yet the economy is only delivering a mediocre performance. Overall, my sense is that the growth and inflation evidence is slightly more consistent with the long-term Secular Stagnation than with the medium-term Headwinds hypothesis as we do not clearly see a pattern consistent with a shock and a gradual recovery but rather a shift down, albeit moderate, in both inflation and growth notwithstanding extreme monetary easing.
5. Patterns of interest rates as discriminating factor
As no conclusive evidence to discriminate between the Secular Stagnation and the Headwinds theories could be found by looking at growth and inflation, it is natural to look at interest rates, which combine these two variables, together with the influence of the central bank.
Three perspectives are taken to carry out the analysis:
• What does the current behaviour of nominal and real interest rates tell us when we look at it in a long historical perspective?
• What do markets expect for the future?
• Which level of the natural rate is consistent, in a Taylor rule approach, with current FED and ECB interest rates?
Before dwelling with these three points, a first, partial, impression can be gathered from figure 4.
Figure 4. “Global” ten-year government bond yield and inflation, 1970-2016.
Legend: Updated after IMF April 2014 WEO; Series are computed as a simple average of the values for the following countries: Germany, France, United Kingdom, United States.
Source: ECB SDW, US Treasury. The green vertical line marks the beginning of the crisis.
Here we clearly see that nominal interest rates and inflation are very low with respect to their level at the turn between 1970’s and 1980`s. The vanishing distance between the two lines tells us that also the real interest rates have come down progressively over this period. The figure does not clearly show a shock corresponding to the Great Recession, whose beginning is marked by the green vertical line, and then a gradual recovery, as the Headwinds hypothesis would imply. The visual evidence is more for a trend decline of both inflation and nominal and real interest rates over the last 3-4 decades, albeit with quite some irregularities, than for a cyclical pattern. As such, the evidence is more in favour of the Secular Stagnation rather than the Headwinds theory. We cannot exclude, however, a different, more complicated explanation, which would consider the decrease in inflation and interest rates from 1980 to 2008 as a success story resulting from a better management of the economy through monetary policy. Instead, the subsequent fall of these two variables during the Great Recession, which is taking place despite policy efforts to reverse it, could come from the debt supercycle.
We can hope to find more evidence to discriminate between the two hypotheses looking further back in the past. We do this first for a few centuries with better data and then for a few millennia with somewhat more sparse data.
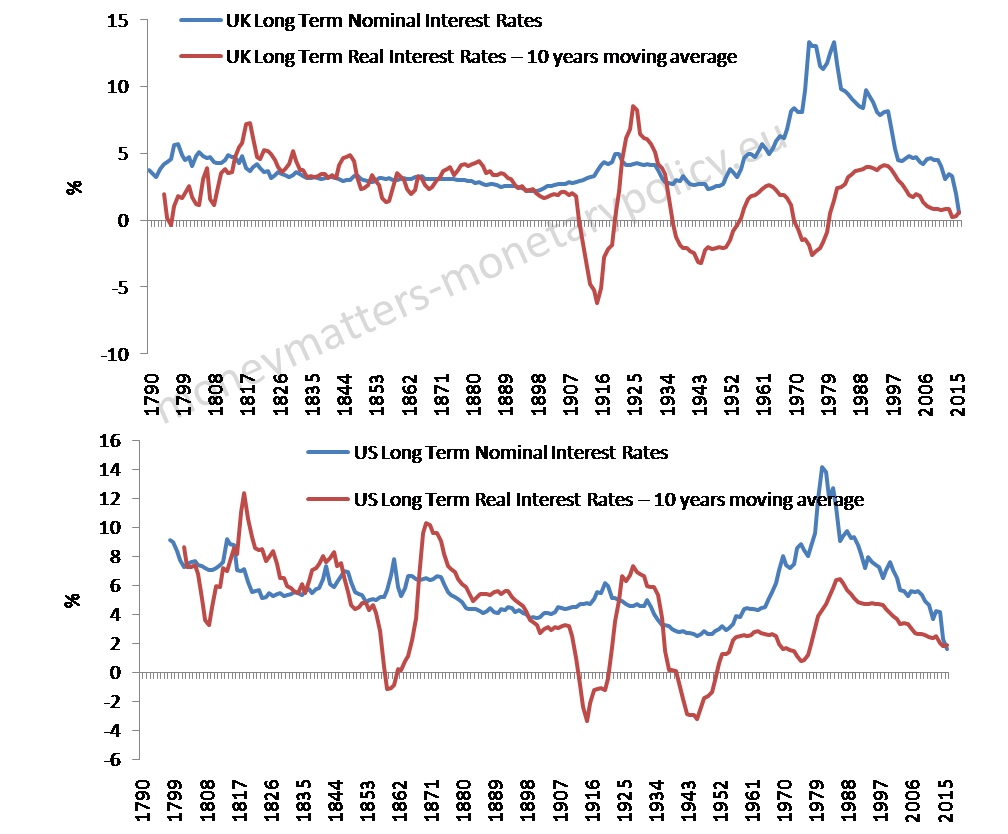
Fig. 5 Nominal and real interest rates, United States and United Kingdom, a secular perspective .
Source: Lawrence H. Officer, ‘What Was the Interest Rate Then?’ MeasuringWorth, 2015.
In the two panels we find a confirmation of the development in the previous figure: nominal and real interest rates have come down a lot since the turn between the 1970s and the 1980s in both the UK and the US. However, in a long historical perspective, the nominal high rates reached some 40 years ago were clearly an exception: in no year since the end of the 18th century have nominal rates been so high in either country. Somewhat symmetrically, nominal rates are exceptionally low now, indeed well lower than they have ever been since the end of the 18th century. The conclusion is that the fall of interest rates since the turn between the 1970s and the 1980s and now cannot be properly assessed without taking into account that both the high level then and the low level now have, in historical perspective, no precedent. The reading of the real interest rate lines is more difficult as this variable is affected by ex-post inflation, which introduces a lot of noise in the estimation, notwithstanding the use of a moving average centered on the year in which the interest rate is observed. Still, we can observe that a real rate as low as today, while not unprecedented, is exceptional, as it was observed only in five episodes in the UK and the United States over the last 230 years One can see, in addition, that most of these previous episodes coincided with wars: the two World Wars and the Civil War in the United States. Overall, nominal and real interest rates as low as currently observed in the United States and the United Kingdom are very exceptional events.
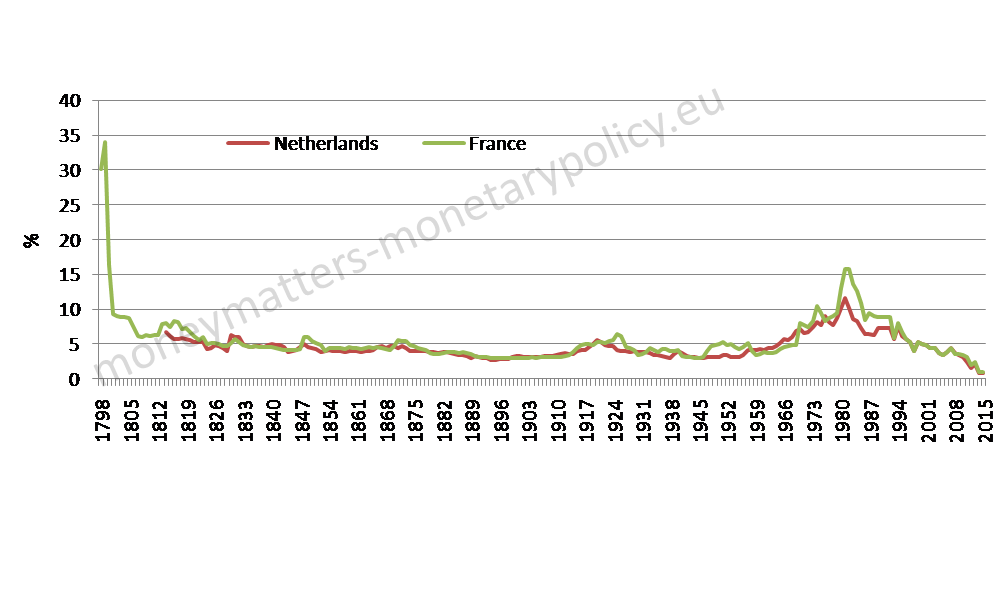
Also for two current €-area countries, France and the Netherlands, we can go back in the past in observing interest rates.
Fig. 6 Nominal long-term interest rates, France and the Netherlands, a secular perspective.
Source: S. Homer and R. Sylla, A History Of Interest Rates, Third Edition, Rutgers University press, 1991.
Unfortunately, we could not find inflation data going back more than two centuries and so, unlike in the previous figures, only the nominal rates are reported. However, we can assume that for much of the period covered in the figure some sort of commodity money prevailed and thus inflation should not have such a dominating influence on nominal rates, even admitting that it was not Irving Fisher who clarified the distinction between real and nominal rates and that people from the time of Enlightenment had already understood it.
Figure 6 confirms, for the two continental European countries, the two developments observed in the previous one: the level of interest rates was exceptionally high between the end of the 1970s and the beginning of the 1980s and is exceptionally low now. More specifically, before the more recent case, we only see rates higher than 15 per cent at the end of the eighteenth century in France, corresponding to the French Revolution! This chart also confirms the fact that rates are now exceptionally low: rates as low as they are now have no precedent in the Netherlands and France in the more than two centuries of data presented in figure 6.
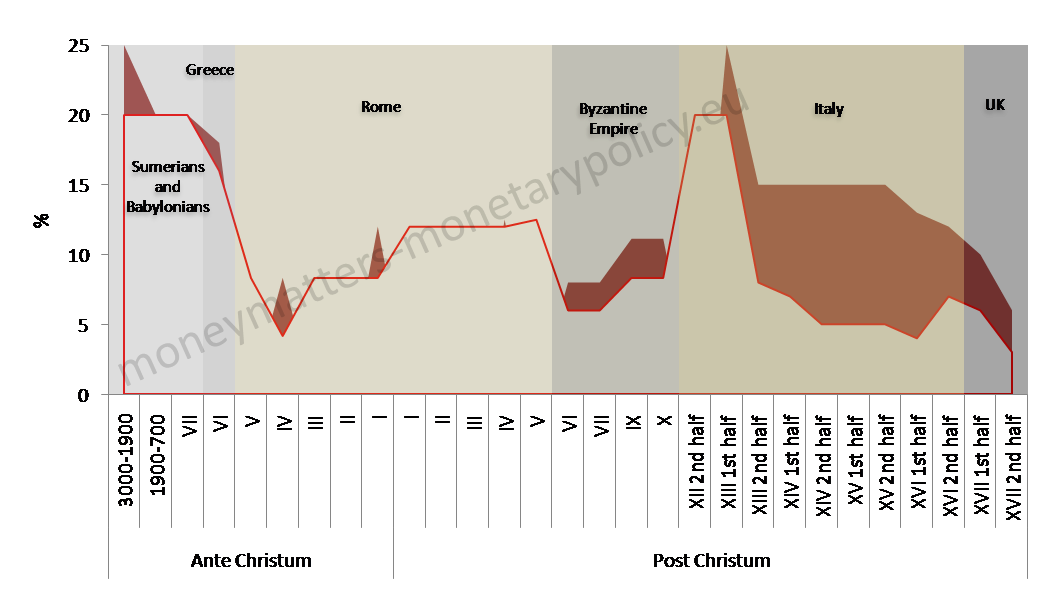
As mentioned above, one can try and see whether the two phenomena observed in the previous figures – exceptionally high rates in the 1970s and exceptionally low rates now – are confirmed looking even further back in the past. Of course the information on interest rates available for the last 5 millennia is scarce and imprecise. With some boldness this is reported in figure 7, again using the data gathered by Homer and Sylla.
Figure 7. Nominal interest rates, millennia perspective.
Source: Homer and Sylla. Where available higher and lower rates are reported.
In figure 7 we find no evidence of zero and even less negative rates even going back to 3.000 B.C.[13] Of course a finer selection could find some episodes of very low rates, matching the current one. For instance A. Giraudo reported zero rates in 33 A.D. under emperor Tiberius in Rome[14]. Still the overwhelming evidence is that rates are currently as low, or even lower, than they have ever been since something like interest rates were measured, millennia ago. Many interesting questions come to the mind looking at the evidence of figure 7, for instance whether, over the centuries, financial integration and legal capacity to enforce contracts lowered interest rates, independently of the developments of growth and inflation. The fact I want to stress here is only that the historical evidence does not, however far back we look in history, suggest that what we see now is a recurrent, i.e. cyclical, however long drawn, phenomenon but more something with little or no precedent.
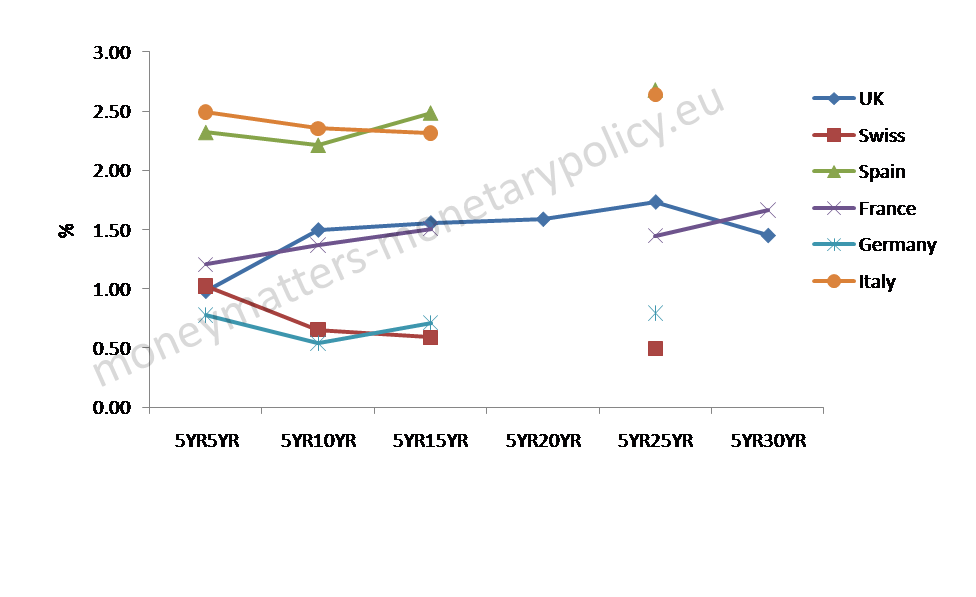
While we can try and go back millennia in the past, the evidence that we have about the future of interest rates is shorter, even if the recent issuance by some national treasuries of 50 year bonds allows us to peer at the next half century.
This is done in figure 8, where, for the countries that have issued long-term (30 or 50 years) bonds, 5 years forward rates are reported as far as possible into the future.[15]
Figure 8. Nominal forward interest rates in selected countries.
Source: Author`s calculations.
The overall message of figure 8 is that financial markets expect rates to remain at a very depressed level for the next 3 to 5 next decades: the current exceptional situation is expected to continue as far as we can look into the future. Of course, we have learnt during the Great Recession to doubt the ability of markets to produce accurate forecasts. If one is unwilling to look at forward rates as “good” forecasts of future rates, one may just consider figure 8 as evidence of the fact that low rates prevail also on the longest part of the yield curve.
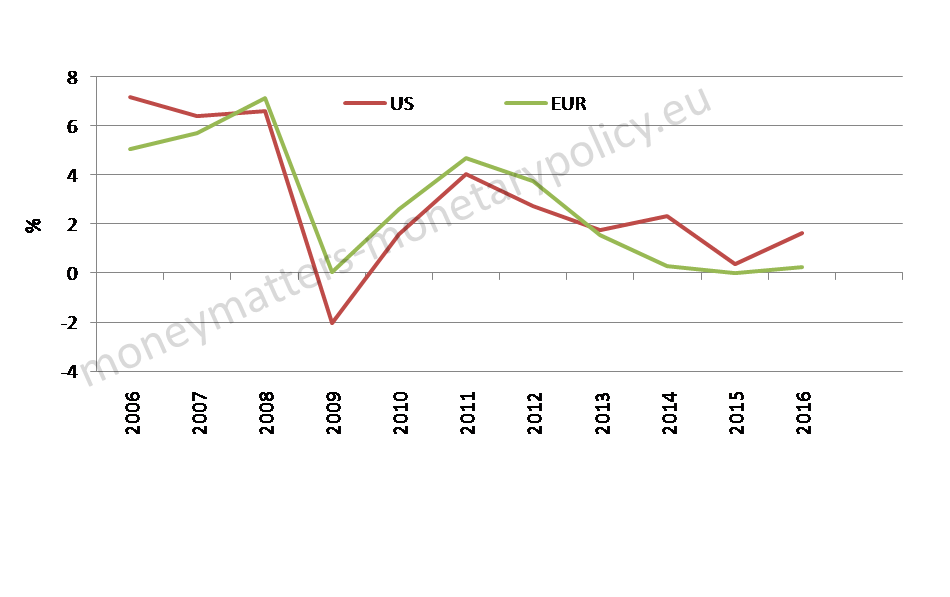
The third perspective to look at interest rates is, as mentioned above, to measure which level of the natural rate is consistent, in a Taylor rule approach, with FED and ECB interest rates. This requires, of course, an inversion of the Taylor rule: this is a normative approach to determine the appropriate level of central bank rates, given the natural rate as well as the inflation and activity gaps. What is proposed here is to start from the central bank rate and determine, for given activity and inflation gaps, what is the natural rate implicit in the Taylor rule. Of course this exercise cannot give “pure” evidence about the natural rate unless one accepts the hypothesis advanced by Coeure, and reported above that the central bank just adapts its rate to a much lower natural rate. If one does not agree 100 per cent with that thesis, the evidence in figure 9 is the joint result between fundamental economic conditions and central bank behaviour.
Figure 9. Natural rate implicit in the FED and ECB policy rates.
 Source: Author`s calculations.
What emerges, not surprisingly, from figure 9 is that the natural rate implicit in the Taylor rule, given the level of central bank rates, has sharply come down with the onset of the Great Recession and now is at about 0 in the €-area and below 2 per cent in the United States.
How does all the evidence harnessed in this section about interest rates help us discriminate between the Secular Stagnation and the Headwinds hypotheses?
Overall, we find no evidence of a hit to, nominal and real, interest rates in correspondence with the Great Recession, which gradually dissipates over time, as it would be implied by the Headwinds theory. What we see, instead, is a fall of nominal and real interest rates over the last 3-4 decades, bringing rates from exceptionally high levels to exceptionally low levels, which have little or no precedent, however far back in the past we look. In addition these levels are expected by the financial market to last for the next 3 to 5 decades. Furthermore, only an exceptionally low natural rate justifies, in a Taylor rule approach, the current rates of the ECB and the FED. This overall configuration of rates does not easily deliver itself to a cyclical interpretation in any sense of the term. Of course it is not possible to exclude, as Goodhart[16] said, that: “The worldwide decline in long-term interest rates and the ratcheting up of bond prices amount to the biggest bubble I have seen in my lifetime, and that frightens me.” Goodhart has a long lifetime to look back, but even if we look much further back in the past we do not find a “bubble” in any way comparable to the one we would be experiencing now according to his interpretation. One is hard pressed to find a precedent for what we currently see.
6. A practical conclusion about monetary policy.
Let me now conclude and come to a tentative answer to the reductionist question raised at the beginning of this essay: what is the likely horizon over which low growth, low inflation and low interest rates will prevail: “Medium-Term”, as in the Headwinds hypothesis, or “Long-Term”, as in the Secular Stagnation?
Of course, it should be recognized that very persistent Headwinds and a short Secular Stagnation tend to coincide. By the way, to a Latin language mother speaker like me, “secular” evokes a time period lasting something like 100 years, while Summers has clearly a much shorter horizon, as he mentions that he has “no useful views about 2040-2050.” [17]
Still the two hypotheses have different time implications: are we in a gradual recovery phase with the pace of growth, and interest rates and inflation, moving back, albeit slowly, to where it was before the crisis, as per the Headwinds theory, or are we confronted with decades of low growth, low interest rates and low inflation, as implied by the Secular Stagnation hypothesis?
I must admit that I started looking at this issue with a prior in favour of the Headwinds approach. I believe there is a lot of wisdom in the financial cycle views of Kindleberger and Aliber, Minsky, Rogoff and Reinhart. I also have a good degree of uneasiness towards the persistence and depth of the unconventional monetary policy measures of the FED and the ECB. Still, I must admit that the evidence regarding interest rates rather pushes in favour of the Secular Stagnation hypothesis, where secular refers, as mentioned above, more to something like one or two decades than a century.[18] It is indeed hard to reconcile the current unprecedented and sustained low level of interest rates with a cyclical phenomenon: we see more an exceptional event than evidence of a cycle. On its side, the pattern of growth and inflation does not contradict the Secular Stagnation view, in particular taking into account the contrast between mediocre macroeconomic performance and extreme monetary easing.
In conclusion, while keeping an attentive eye on developments that could indicate the contrary, I would invert my prior, and adopt the working hypothesis that a decade or more of low growth, low inflation and low interest rates is ahead of us[19]. If anything, this conclusion applies more to the €-area than to the United States. In monetary policy terms, this means that the increase of interest rates may be muted going forward and that unconventional, balance sheet based, monetary policy actions may remain in the panoply of central banks longer than expected[20] and, from my point of view, longer than desirable, given the side-effects that they bring. The consequences of this state of affairs for inflation targeting are ambiguous. On one hand, one could argue that the central bank should stop fighting the windmills and accept that fundamental forces are depressing the rate of inflation and lower its target correspondingly. On the other hand, one may stress the need for the central bank to have more room to reduce rates in case of recessionary tendencies by increasing its inflation target.
This paper was prepared with the assistance of Madalina Norocea. Charles Goodhart and Stephen Jen sent some perceptive comments. Andrea Papadia provided useful advice about historical material and suggestions.
________________________________________
[1] A. Hansen, Economic progress and declining population growth (speech for AEA meetings 1938), American Economic Review, March 1939. Vol XXIX, NO. 1, PART I.
[2] K. Rogoff, Debt Supercycle, Not Secular Stagnation, in Progress and Confusion, O. Blanchard, R. Rajan, K. Rogoff and L. Summers editors. MIT Press. B. Bernanke, The Global Saving Glut and the U.S. Current Account Deficit, Remarks at the Sandridge Lecture, Virginia. Association of Economists, Richmond, Virginia, March 10, 2005. R. Gordon, The Rise and Fall of American growth: The US Standard of Living Since the Civil War. Princeton Press. C. Goodhart, M. Prasdhan, P. Pardeshi, Morgan Stanley Research Global Economics, Could Demographics Reverse Three Multi-decade Trends? September 15, 2015.
[3] The Bruegel Policy Contribution, Issue n˚15 | 2016 Low long-term rates: bond bubble or symptom of secular stagnation? by G. Claeys, also addresses the link between low interest rates and the Secular Stagnation hypothesis.
[4] Summers, Rethinking Secular Stagnation after Seventeen months. In Progress and Confusion, O. Blanchard, R. Rajan, K. Rogoff and L. Summers editors. MIT Press.
[5] Paul De Grauwe, Secular stagnation in the Eurozone, 30 January 2015. VOX CEPR Policy Portal.
[6] G. Wolff, How can Europe avoid secular stagnation? Post In Bruegel, November 25 2014.
[7] J. Taylor, Discretion versus policy rules in practice. Carnegie-Rochester Conference Series on Public Policy 39 (1993) 195-214
[8] This variable has a less snappy name in FED Jargon: “Longer run Federal funds rate”.
[9] B. Bernanke, Why are interest rates so low, Part 2, Secular Stagnation. Blog of B. Bernanke, 31st March 2015.
[10] At the latest meeting, the FOMC tweaked it even further to 2.9 per cent.
[11] This seems to be the direction to which John C. Williams is leaning: FRBSF Economic Letter, 2016-23. August 15, 2016. Monetary Policy in a Low R-star World.
[12] B. Coeure, Speech in Jackson Hole, August 2016. The ECB Vice President, Constâncio, expressed the same view: “A superficial, impulsive answer is that rates are low because monetary policy keeps them low. However, in reality, low rates are the result of real economy developments and global factors, some of which are of a secular nature and others relate to the financial crisis.” The challenge of low real interest rates for monetary policy, Lecture by Vítor Constâncio, Vice-President of the ECB, Macroeconomics Symposium at Utrecht School of Economics, 15 June 2016.
[13] I had made this same comment in a post on my blog: Should we worry that we have about the lowest interest rates in the history of humanity? 30 September 2015.
[14] A. Giraudo, « Europe’s classical legacy: zero rates were introduced by Tiberius in 33 AC” as part of a liquidity providing operation.
[15] This conclusion is consistent with the extrapolation of the ECB and the FED balance sheet I carried out in: “How should central banks steer money market interest rates?”, Presentation prepared for the Columbia-SIPA FED NY Conference on “Implementing Monetary Policy Post-Crisis – What Have We Learned? What Do We Need To Know? May 4th 2016. This extrapolation showed that the FED and the ECB balance sheets would not get back to normal before 2023 and 2028 respectively.
[16] C. Goodhart, Innovative fiscal policy needed to back Bank of England easing. OMFIF commentary, 22nd August 2016.
[17] Ellen Zentner and Michel Dilmanian from Morgan Stanley, in Well Beyond the Fall, September 1 2016, carry out their analysis in a border territory between the Secular Stagnation and the Headwinds hypotheses.
[18] The FED Vice President, Fischer, seems to be inclined in the same direction: „…a lower level of the long-run equilibrium real rate suggests that the frequency and duration of future episodes in which monetary policy is constrained by the ZLB will be higher than in the past.” Speech at the Annual Meeting of the American Economic Association, San Francisco, California, January 3, 2016, Monetary Policy, Financial Stability, and the Zero Lower Bound.
[19] This conclusion is germane to the one reached by Hördahl and others: “The paper …argues that recent estimates of unobserved constructions such as the shadow policy rate, the natural rate and the term premium in the long-term rate suggest the “new normal” is lower than in the past.” BIS Working Papers No 574. Low long-term interest rates as a global phenomenon, by P. Hördahl, J. Sobrun and P. Turner Monetary and Economic Department. August 2016.
[20] This conclusion was also put forward by J. Yellen in her recent Jackson Hole speech: „…I expect that forward guidance and asset purchases will remain important components of the Fed’s policy toolkit.“

Dear Francesco, it’s a fascinating paper, especially the long-term, secular and even millennia perspective on the development of the last four decades that many of us have in living memory.
However, I miss two aspects in your analysis – both of them supply-related, whereas your explanation of interest rate fluctuations relies heavily on demand factors.
I think that technological progress tends to come in waves and that these waves necessarily will be reflected in productivity growth and hence in the natural rate of interest (both nominal and real).
The second aspect is the political economy: economic agents’ behaviour is strongly influenced by the political constellation – in particular the political economy determines to a large extent whether investment is channelled into production factors that make the economy more dynamic (promising a higher natural rate of interest) or into less productive capital equipment such as defence, internal security or in our modern times mitigation of damage on the environment (externalities that we can hardly measure with the notion of GDP growth) – leading to a lower or even negative growth in production potential and thus in the natural rate of interest.
I may have expressed myself clumsily, but I hope you can see what I mean, and I’d be grateful for your comment!
Dear Niels,
many thanks for your comments, with which I basically agree. My only defence is that I looked at the issue from a specific perspective, without pretending to have given an exhaustive treatment. Supply and political economy aspects are important ones. Maybe in a new post?
This is a very interesting read, thanks for sharing. I think we can perhaps go a bit further in trying to find evidence for either of the two major theories being considered here by looking at some proxies that might help us better distinguish between them.
To further consider the debt supercycle theory, for example, if a major debt cycle was occurring then we would expect to see continued household deleveraging, which we do (https://fred.stlouisfed.org/graph/fredgraph.png?g=7EkP). The numbers are even worse if you adjust for student loans. If deleveraging was not currently taking place it would be easier to rule against this theory, but I think as long as we see households paying down debts despite low rates, it will be difficult to fully rule out that theory. Similar numbers from eurostat (with the interesting exception of France) suggest it’s a broader phenomenon (http://ec.europa.eu/eurostat/web/products-datasets/-/tipspd20). Richard Koo has documented similar developments in Japan.
To further consider the secular stagnation theory, if we really rates will be low because of lower nominal growth, then we would expect to see low productivity, TFP, and/or inflation. Of course those are well documented trends as well.
Distressingly, there is nothing mutually exclusive about these competing theories. An interesting question is to what extent are they related or is it purely bad luck that they are occurring together? I could see either being argued as “more fundamental” or the “prime mover.” For example, in a world where the general rate of growth, productivity, and technology is expected to be say 5% might justify a certain level of borrowing and investment. If that rate is suddenly adjusted down, then much of the investment made with previous expectations will go bad and must be worked off. On the other hand, excess borrowing may result in an extended period of depressed demand, and suddenly much investment in research, technology, and productivity advancement might no longer be able to be justified on the expectations of lower future sales.
Like everyone else, I don’t have any good answers to these questions and I appreciate you thoughtfully laying out many of the issues here. Though I have some suspicions, I still think there is a lot of work to be done before I’ll be persuaded either way conclusively.
Many thanks for your useful comments.
I am not sure, also after having looked at the evidence you link too, whether your reading is that indeed debt is decreasing, as it would be implied if we were deleveraging out of a phase of excessive debt, or not. My understanding is that if you look at debt of both the private and the public sector there is no deleveraging. What is your conclusion on this.
I agree that one should not overdo the inconsistency between the two theories, we may have both working at the same time. Still I think it is interesting to try and guess for how long will we live in this low interest rates, low growth and low inflation period. At the end, this is the answer for which I am trying to find some elements of answers in my post.
Francesco, thanks for the thoughtful response.
Regarding deleveraging across sectors, certainly consolidating public and private debt displays a different kind of aggregate dynamic, but I think it also obscures the economic cycle taking place. Governments took on substantial debt following the crisis at least as much due to loss tax receipts and assumption of bad private sector debt as any tepid fiscal stimulus. Either way, public debt is either endogenous to the private debt cycle or a policy choice, unlike private debt which appears to have an economic cycle of its own (a la Minsky).
The distinction matters for thinking about the debt cycle for at least three reasons. First, the private sector is larger. Second the private sector is the underlying source of growth. As mentioned above, public sector balance sheets are at least to a significant degree a reflection of the private sector. If households are saving to pay down debts instead of spending, tax receipts decrease and public debt increases. Therefore we should expect a certain degree of offsetting between the sectors, but the steady consolidated numbers don’t reflect steady aggregate demand because the government is, for the most part, not adding spending, but rather losing income.
Third, households are under immediately binding financial constraints in a way that the public sector is not. Excluding small open economies without autonomous monetary policy, the government is an infinite-lived agent with some degree of control over its financing costs. As a result, their time frame for repayment and debt load capacity is significantly higher than households. While that capacity is not unlimited, it is fundamentally different than overleveraged households for whom slight increases in debt burdens from, say, lost income immediately translates into forced deleveraging and reduced aggregate demand.
Because of these things, I believe the private debt cycle is the debt cycle insofar it is a cycle. Public over-indebtedness is, of course, important in its own right for a variety of reasons, but if we want to understand whether debt is affecting aggregate demand, I think private sector, particularly household debt, is where it is important and where we see it. Do you think that is a reasonable interpretation?
Regarding the consistency of the competing theories, I absolutely agree that we should endeavor to distinguish between them to the extent that we can in order to better understand what the future may hold for interest rates and the broader economy. I think your work here gives an honest and useful analysis of the issue, offering a practical framework for comparison. I particularly appreciated the historical and international context.
Private sector deleveraging continued for nearly 2 decades following the great depression and Japan’s crisis. Both Richard Koo and Bridgewater have offered some thoughtful research on these and other historical deleveragings. The current situation in the US has been handled (mostly) better (Europe, less so), so we may not have another decade to wait, but the debt cycle thesis is about a long, long cycle such that I think some of the evidence about expected future rates is not yet dispositive. Markets are learning as quickly (or slowly) as economists that current situation will not be reverting as quickly as expected (after all, it was us economists in the US and Europe in early 2012 calling for normalization).
Nonetheless, if history is any guide we may also find ourselves in a couple years once again revising priors and quickly (or slowly) learning again what may have seemed several before impossible. While it is not an argument of any kind, I do smile a bit to think that Hansen penned his thesis roughly a decade after the crash, about half a decade before the bottoming out of US private sector deleveraging and the subsequent half a century of robust growth and re-leveraging. If the debt cycle theory is true (to which I lean, but with some reservation), it’s a bit amusing to think we’re about right on time.