Gli Alisei or the Trade Winds and the Treasuries yields
The Trade Winds, or Alisei in Italian, flow constantly from North East to South West in the Northern Hemisphere. In the financial sphere, instead, winds have been flowing mostly in the opposite direction. As shown in many studies, for instance by Michael Ehrmann, Marcel Fratzscher, Roberto Rigobon and John H. Rogers, Chiara Scotti and Jonathan H. Wright, changes in US financial variables, pre-eminently interest rate and equity prices, influence financial conditions in Europe more than the latter influence the former.1 This post is dedicated to checking whether, during the Great Recession, ECB monetary policy innovations help explain Treasury yields, in particular their very low level, prevailing even now that the FED purchases have been stopped and the US economy is recovering quite consistently. Of course detecting an influence of €-area monetary policy innovations on US yields does not exclude at all the influence of FED actions on the €-area. Still finding that the ECB influences financial conditions in the US would be an interesting finding. From a policy point of view, when deciding about its interest rates, the FED should incorporate the effects of ECB action: for example, if the latter would indeed decide to go for QE there could be a downward effect on US rates that the FED may want to offset. From an investment point of view, it would not be sufficient to look at US variables to bet on American interest rate developments: integrating an analysis of ECB action would be necessary.
Documenting that treasury yields in the US are historically low is quite straightforward. Chart 1 reports daily yields of 2 and 10 year treasury yields since the beginning of the Great Recession, which I put on August 2007. The persistently low level of yields has caused much chagrin in all those investors that had bet on an increase because of regained strength of the US economy and the end of the FED large purchases.
Chart 1: Treasuries yields
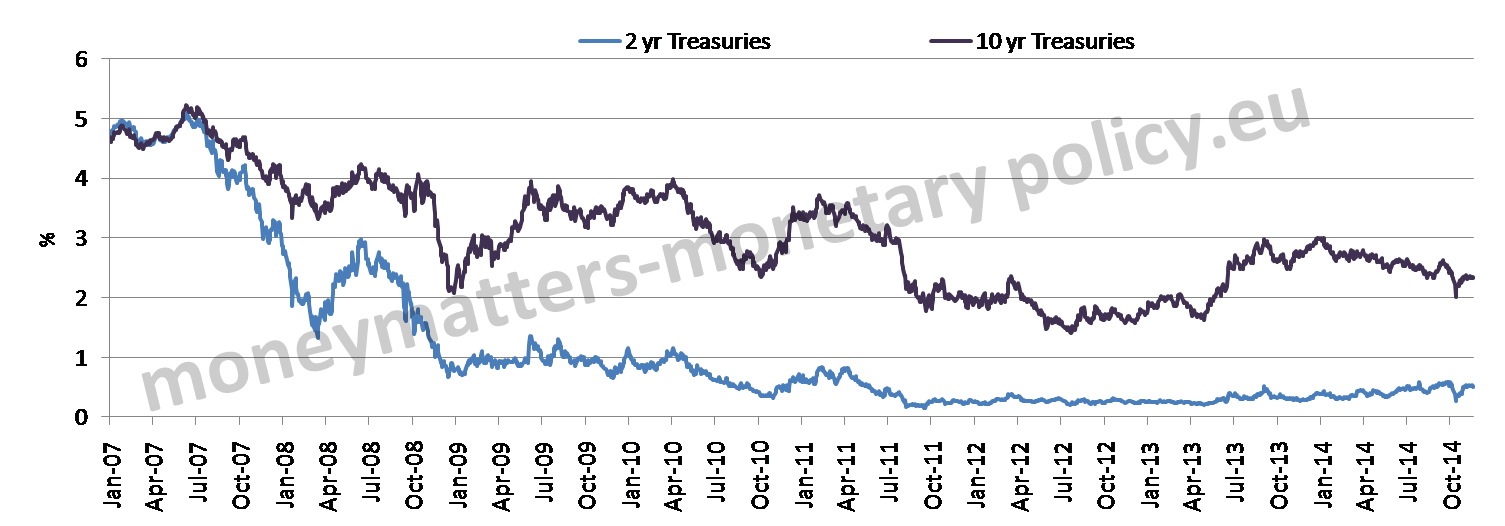
Source: Blooomberg, ECB, Author’s calculations
Chart 2 shows that the phenomenon of historically very low yields is even more evident in real rates, which are close to zero after having been negative, on both the 2 and the 10 year maturity, until quite recently.
Chart 2: Real Treasuries yields
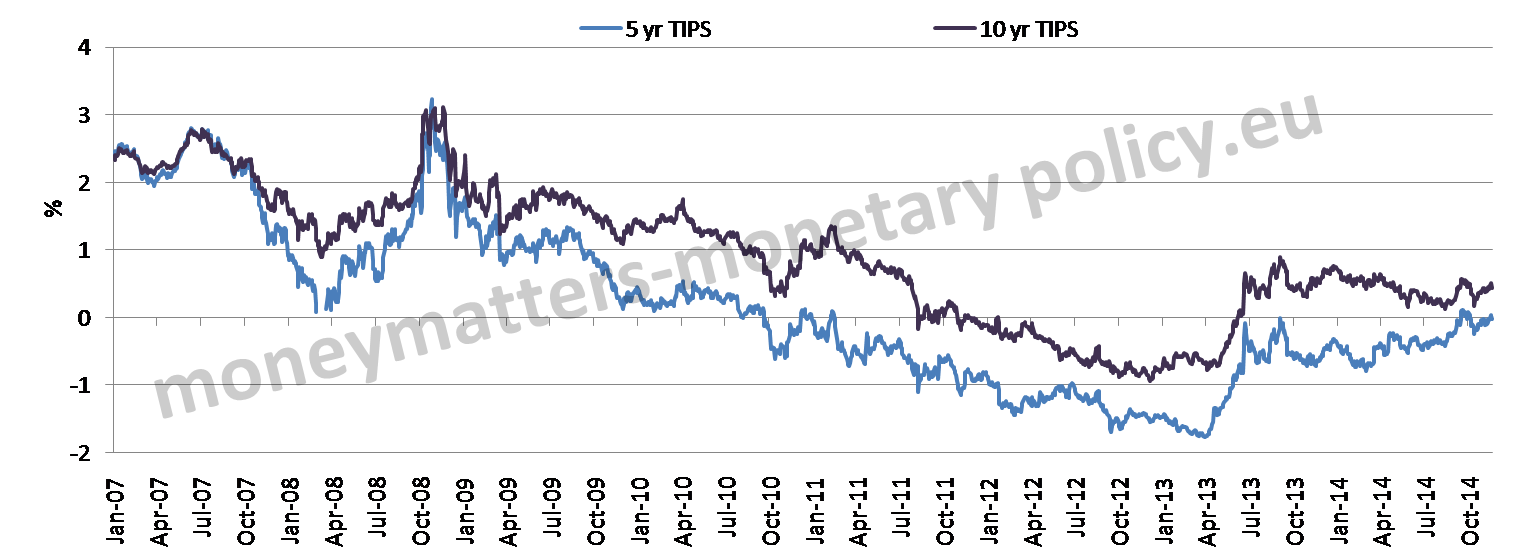
Source: Blooomberg, ECB, Author’s calculations
Many factors explain the low level of Treasuries yields and no comprehensive explanation is attempted here. The more limited purpose is to ascertain whether there is some contribution from ECB actions to this behaviour.
In order to do this the table on ECB monetary policy news from Rogers, Scotti and Wright was updated with most recent news. Then for every date with a news it is ascertained whether there was in the day of the move a significant change of the log-price of an effective €-area 2 years security. By effective €-area security I mean a basket security, composed of German, French, Italian, Spanish, Portuguese, Belgian, Austrian, Finnish, Dutch and Slovenian securities, each weighted by its rescaled weight in the ECB capital key. A significant move is defined as one exceeding twice a 90 days standard deviation of log-price first daily differences. The resulting “ECB dates”, reported in the table in the annex, are thus derived from a double filtering: first the dates on which some news was announced, second when a significant move in a composite €-area bond price indicates that there was an element of surprise in the piece of news. To get a first impression of a possible influence of the ECB action on treasury yields, bars representing the ECB dates are superimposed on charts 1 and 2 above, as in charts 3 and 4. A red bar denotes an ECB tightening date, i.e. a date in which the price of the composite €-area bond went down, a green bar denotes an ECB easing date, i.e. a date in which the price of the composite €-area bond went up.
Chart 3: ECB dates and Treasuries yield
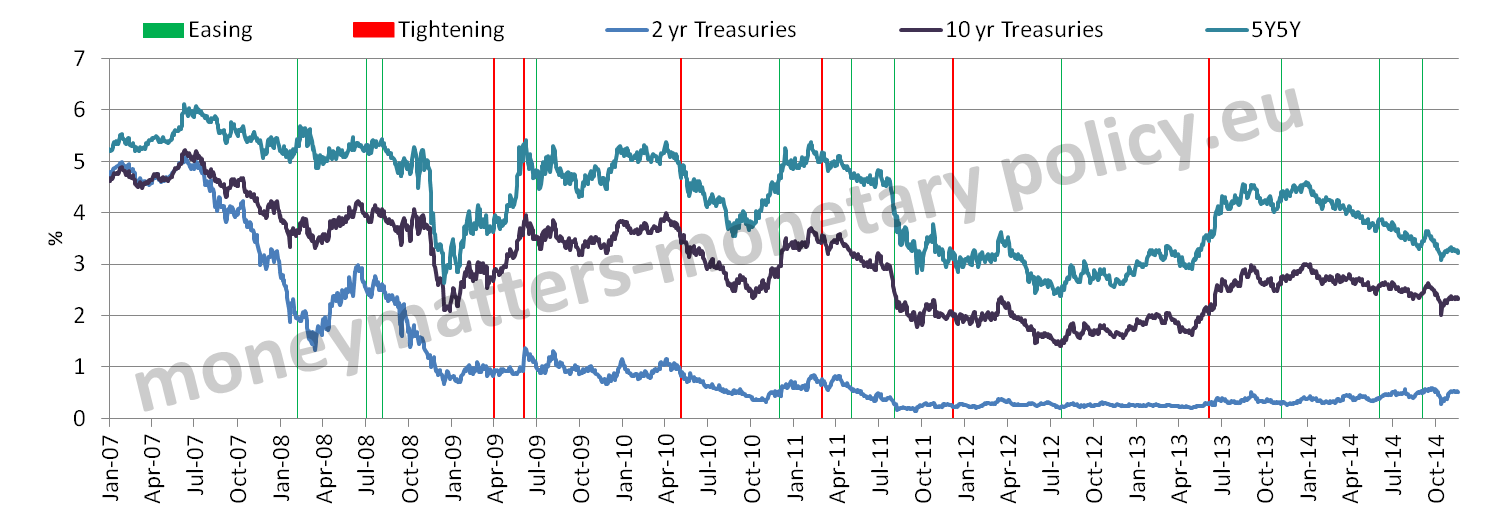
Source: Blooomberg, ECB, Author’s calculations
Chart 4: ECB dates and Treasuries real yield

Source: Blooomberg, ECB, Author’s calculations
The reading from the charts of a possible effect of ECB dates on the Treasuries yields, both nominal and real, is not easy. In order to identify a summary indication of whether the ECB moves had an effect on Treasury prices, table 1 summarises the information of charts 3 and 4. In the table the average change in 2 year and 5 year in 5 year nominal forward log-price as well as the 5 and 1o year Tips Treasuries log-price is reported for tightening and easing ECB dates as well as for non-ECB dates. For comparison the average log-price change for the 2 year composite € security is also reported.
Table 1: Average changes in USD swap forward prices, ECB vs non ECB dates. Basis points.
| ECB easing | ECB tightening | Non-ECB dates | |
| USD 2 YR | 5 | -4 | 0.4 |
| USD 5Y 5Y fwd | 0.5 | -19 | 0.5 |
| EUR 2 Y | 16 | -19 | 0.2 |
| Tips 5Y | 3 | -28 | 0.9 |
| Tips 10Y | -0.3 | -42 | 1.1 |
Source: Blooomberg, ECB, Author’s calculations
In the table one sees under the third column that there is, on average, no large price change for any of the considered security in Non-ECB dates, even if there is a trend toward higher prices, which could already be detected in the decreasing yields of Charts 1 and 2. In the first column instead, one sees that prices of nominal US Treasuries moved on average up, in particular on the shorter maturity, on the occasion of ECB-easing moves, even if, as one could expect, the upward move was only about one third of the move of the composite €-area security. Symmetrically, prices of Treasuries tended to go down in ECB tightening dates. Indeed in this case the move extended to longer maturities and to real bonds. On average the effect on US yields of ECB tightening moves is quite larger than that of easing moves. Overall, the hypothesis that ECB monetary policy moves have an effect on US Treasury yields is confirmed by the results in table 1.
One can get an idea of the cumulative effect of the different ECB actions on the considered US securities by multiplying the average effect by the number of ECB dates of either easing or tightening nature. For instance, the cumulative effect of the 11 (there are 12 easing dates but one falls on the 4th of July, when the markets are closed in the US) ECB easing moves would be 55 basis points on the 2 years Treasury price, but only 33 basis points or less on the other maturities.This translates into a 32 basis point reduction of the yield of the 2 year Treasury and 8 basis point reduction for the 5 year TIPS, for example. As mentioned above, the effect of the individual ECB tightening measures is estimated to be quite stronger, especially on the longer maturities. As a result, the cumulative effect of the 6 tightening moves is 24 basis points on the price of the 2 years maturity (14 basis point in yield terms) but 100 basis points or more on the other maturities (the biggest drop is estimated for the price of the 10 year TIPS at 250 basis points that corresponds to 32 basis points in yield terms). The net effect is, of course, the difference between the cumulative effect of easing and tightening ECB measures, which is in most cases estimated to lead to lower Treasury prices. Thus the individual ECB easing and tightening moves help explain the day to day changes in Treasury prices but offer, on a cumulative basis, an explanation of lower US yields only for the short 2 year maturity. In the other cases, since the fewer ECB tightening moves in the period have a larger effect than the more numerous easing moves they lead to a decrease of the price of US securities.
Overall, one cannot fully understand the day to day change of yields in the US without also considering the effect of ECB monetary policy moves. Those who invest in Treasuries and the FED have to keep an eye on the ECB when deciding their investment or their policy actions. However, ECB moves do not offer a significant contribution to explain the persistent low level of yields in the US.
Madalina Norocea provided research assistance while Brian Sack, my former counterpart at the New York FED, who is now at the D. E. Shaw Group, offered useful comments on a draft of this post.
Annex
| Date | EUR 2YR yield | Derived Price | Difference ln | Standard deviation ( 90 previous days) | Event |
| 7-Feb-08 | 2.11 | 95.91 | 0.00171 | 0.00071 | GC meeting |
| 3-Jul-08 | 2.97 | 94.31 | 0.00225 | 0.00092 | GC meeting, MRO rate increased to 4.25% |
| 7-Aug-08 | 2.73 | 94.75 | 0.00192 | 0.00086 | GC meeting |
| 2-Apr-09 | 1.14 | 97.76 | -0.00214 | 0.00080 | GC meeting, MRO rate decreased to 1.25% |
| 4-Jun-09 | 1.11 | 97.82 | -0.00171 | 0.00069 | GC meeting, CBPP details announced |
| 2-Jul-09 | 0.93 | 98.17 | 0.00155 | 0.00069 | GC meeting |
| 6-May-10 | 0.96 | 98.11 | -0.00095 | 0.00042 | GC meeting |
| 2-Dec-10 | 1.12 | 97.79 | 0.00180 | 0.00046 | GC meeting |
| 3-Mar-11 | 1.54 | 96.99 | -0.00261 | 0.00061 | GC meeting, FRFA extended to July 2011 |
| 5-May-11 | 1.73 | 96.64 | 0.00137 | 0.00060 | GC meeting |
| 4-Aug-11 | 1.83 | 96.43 | 0.00147 | 0.00068 | GC meeting, SMP covers Spain and Italy |
| 8-Dec-11 | 1.88 | 96.35 | -0.00281 | 0.00134 | GC meeting: Two 3-year LTROs, reserve ratio to 1%, MRO rate to 1% |
| 26-Jul-12 | 1.22 | 97.61 | 0.00378 | 0.00107 | Whatever it takes” London speech |
| 6-Jun-13 | 0.55 | 98.90 | -0.00125 | 0.00040 | GC meeting |
| 4-Jul-13 | 0.58 | 98.85 | 0.00120 | 0.00050 | GC meeting |
| 7-Nov-13 | 0.42 | 99.16 | 0.00104 | 0.00034 | GC meeting, MRO rate to 0.25%, MLF rate to 0.75%, deposit rate unchanged to 0% |
| 5-Jun-14 | 0.20 | 99.61 | 0.00070 | 0.00025 | GC meeting, MRO to 0.15%; MLF to 0.40%; depost rate to -0.10% |
| 4-Sep-14 | 0.04 | 99.92 | 0.00076 | 0.00023 | GC meeting; MRO to 0.05%; MLF to 0.30%;deposit rate to -0.20% |
Source: Blooomberg, ECB, Author’s calculations
- Michael Ehrmann, Marcel Fratzscher, Roberto Rigobon, Stocks,bonds, money markets and exchange rates: measuring international financial transmission, NBER working paper series, March 2005; John H. Rogers, Chiara Scotti, Jonathan H. Wright, Johns Hopkins, Evaluating Asset-Market Effects of Unconventional Monetary Policy: A Cross-Country Comparison, Board of Governors of the Federal Reserve System, International Finance Discussion Papers, March 2014 [↩]
