Wealth redistributions: what inflation did in the 1970s, the interest rate is (mostly) doing now.
The redistributions of wealth on debtor and creditor positions caused by changes in interest rates and inflation are again an important economic policy variable.
This post gives rough estimates of these redistributions, showing that the low level of interest rates has caused since 2004, and with more force since 2009, important redistributions in favor of debtor sectors, in particular the Government and Non-financial Corporations, and against creditor sectors, in particular Households and the Rest of the World. In a way, very low interest rates have generated for these sectors redistributions comparable to those brought about by high inflation in the 1970s and 1980s.
The results for Financial Corporations are, instead, very different from those recorded in the 1970s and 1980s. These corporations have small financial net positions resulting from large interest bearing assets (like loans and securities) and large non-interest bearing liabilities (like deposits). These positions, interacting with the recent very low level of interest rates, have determined on average negative redistributions over the 2004-2015 period, in contrast with the large positive redistributions recorded in the 1970 and 1980s. The negative redistributions have in particular been large since 2009, because of the very low level of interest rates. This evidence reinforces the view that the profitability of financial corporations, and in particular banks, is now substantially affected by the prevailing low interest rates.
Another notable difference between now and the experience in the 1970s and 1980s is that unexpected inflation played a much lesser role in recent years.
Back in 1985, A. Cukierman, K. Lennan and I published a paper in which, looking at the evidence of the 1970`s and early 1980`s, we documented that “the level of inflation-induced redistribution is by no means trivial” 1 . For example, the household sector lost in Italy, France and the UK an amount equal to about 3.8 per cent of its consumption year after year between 1974 and 1982. The government was the big gainer from inflation redistributions: for amounts equal to 7.9 per cent of its revenue in Italy and 4.0 and 2.6 per cent respectively in the UK and France. Only in Germany were the redistributions small, because of lower inflation. Still households lost, on average over the period, the equivalent of 1.4 per cent of their consumption and the government gained 1 per cent of its revenue through inflation redistributions.
In the 1985 paper we also estimated the expected and the unexpected components of inflation redistributions, stressing that “the levels of uncertainty caused by unexpected redistribution are sizable…” 2 .
In this post the exercise of the 1985 paper is repeated for the recent period of very low inflation and interest rates to estimate the size of the inflation-induced redistributions among sectors (Households, Non-financial Corporations, Financial Corporations, Government, Rest of the World). Of course, redistributions across sectors are not the same thing as redistributions between creditors and debtors. Still they are a good proxy, since Households are overall creditors, while Non-financial Corporations and, even more, the Government are overall debtors. Financial Corporations and the Rest of the World normally have relatively small net financial positions.
The conceptual framework used in this post is closely borrowed from that of the 1985 paper. Total inflation induced redistributions for sector i at time t can be estimated as 3 :
Where:
The first term on the right of the equation represents expected redistributions on Interest Bearing Assets (IBA), which are determined by multiplying Lit, i.e. the net financial assets of sector i, by the difference between the expected real interest rate (it+πet) and the “normal” real rate that would prevail if there was no inflation (in). πet is the loss of purchasing power of money, i.e. the inverse of the rate of inflation.
The second term represents the expected redistribution on Non-Interest Bearing Assets (NIBA or “money”), which is just the expected loss of purchasing power of money times the money holdings of sector i, i.e. Mit.
The third term represents the unexpected redistribution on IBA and NIBA due to unexpected inflation, where u(t+1) is the difference between expected inflation at time t and actual inflation at time t+1.
For the estimation, financial accounts produced by the ECB are considered, just allocating all the assets and liabilities of the different sectors into NIBA and IBA (Non-Interest Bearing Assets and Interest Bearing financial Assets).
For simplicity, a single interest rate is considered as applying to all financial assets and this is the 12 month rate on an Overnight Index Swap contract. The “normal” real interest rate that would prevail if there was no inflation is assumed to be 1.5 per cent, as explained in the appendix.
Inflationary expectations are derived from breakeven inflation, unlike in the 1985 paper in which they were survey based. Break-even inflation has a 12 month horizon.
Redistributions are scaled by sector specific variables: consumption for Households, investment for Non-financial Corporations, net disposable income for Financial Corporations, revenue for the Government and exports for the Rest of the World.
A more precise presentation of the estimation methodology is in the Appendix.
The results for the various sectors of the €-area are presented in Figures 1 to 5.
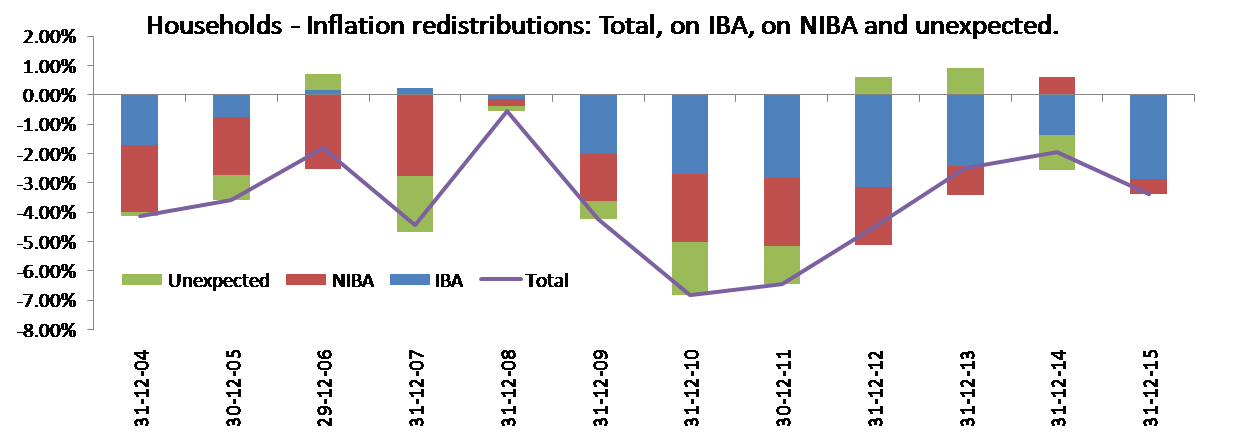
Figure 1. Inflation induced redistributions for Households*.
IBA= Interest bearing assets
NIBA= Non-interest bearing assets
Unexpected= redistributions caused by errors in inflation expectations.
* As a share of Consumption.
Inflation has been much lower in the period examined in this paper than in the 1974-1982 period considered in the 1985 paper mentioned above, but the losses of households on their assets between 2004 and 2015 have been comparable to those realised in the 1970s and 1980s. In fact there have been negative redistributions in all the years from 2004 to 2015, from a minimum of less than 1 per cent of households consumption in 2008 to a maximum of about 7 per cent in 2010 and 2011, with an average of about 4 per cent over the period. The redistributions have been particularly large since 2009 because of the lower interest rates. The comparison between the most recent experience and the 1970s and 1980s examined in the older paper reveals interesting details. First, not surprisingly, the unexpected component of the losses, due to errors in inflation expectations, has been recently much lower and much less variable than in the earlier period. Second, the expected redistributions suffered by households on interest bearing assets in the €-area have been, in the most recent period, similar to those realized in the countries (Italy and UK) that had the highest rates of inflation in the 1970s and 1980s. This means that the very low interest rate in the most recent period has had an analogous effect on redistributions borne by households as the very high rate of inflation in the 1970 and 1980s. It is interesting to observe that negative redistributions on money (NIBA) were present until 2013 and only disappeared in the last two years when expected inflation got very close to zero.
Figure 2. Inflation induced redistributions for Non-Financial Corporations*.
IBA= Interest bearing assets
NIBA= Non-interest bearing assets
Unexpected= redistributions caused by errors in inflation expectations.
* As a share of Investment.
Figure 2, reporting the redistributions for Non-Financial Corporations, shows hefty positive redistributions for non-financial firms in the second half of the sample period (2009 to 2015), when it reaches a peak of 25 per cent of investment. These positive redistributions are due to the large gains on IBA, due to the very low interest rate and the negative financial position of non-financial corporations. The redistributions in favour of non-financial corporations are even larger and more stable over time than those recorded in the 1970s and 1980s, highlighting the potency of low rates of interest in bringing benefits to this sector.
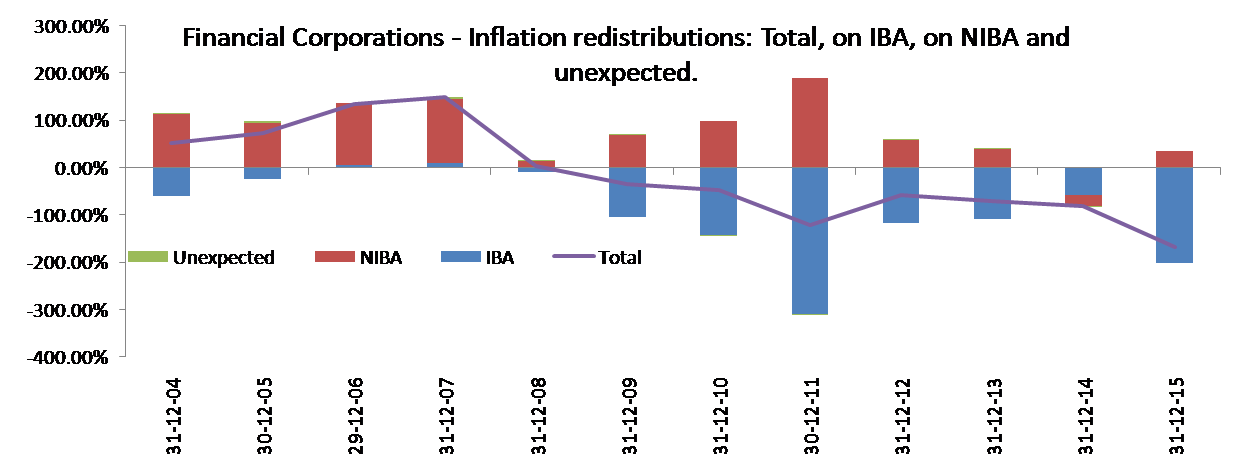
Figure 3. Inflation induced redistributions for Financial Corporations*.
IBA= Interest bearing assets
NIBA= Non-interest bearing assets
Unexpected= redistributions caused by errors in inflation expectations.
*As a share of Net Disposable Income of non-financial corporations.
Financial Corporations have large net negative NIBA and large positive IBA, with a small overall net position. Correspondingly they made large gains, because of inflation, on the former positions but also large losses on the latter, due to the low level of interest rates. The net negative redistributions are then limited, but not insignificant, averaging over the entire period to some 15 per cent of their income. This experience is in contrast with that of the 1970s and 1980s in which Financial Corporations received, with the exception of Italy, positive and mostly large redistributions. The experience of the first part of the recent sample period (2004 to 2008) is, however, very different from that of the second part (2009 to 2015): in the first part Financial Corporations achieved positive redistributions, since the gains on NIBA were not offset by negative redistributions on IBA. In the second period, instead, the low level of interest rates brought the total redistributions deep into negative territory, equivalent to around 100 per cent of their income. Of course, the assumption of a single interest rate on all assets and liabilities shows particularly its limits in the case of financial corporations: if it is assumed that these companies manage to earn a spread of 1 per cent over the nominal interest rate used in the estimation (to recall, the 12 month OIS), the total redistributions become largely positive on average over the entire period, but remain negative between 2011 and 2015, again because of the very low interest rate.
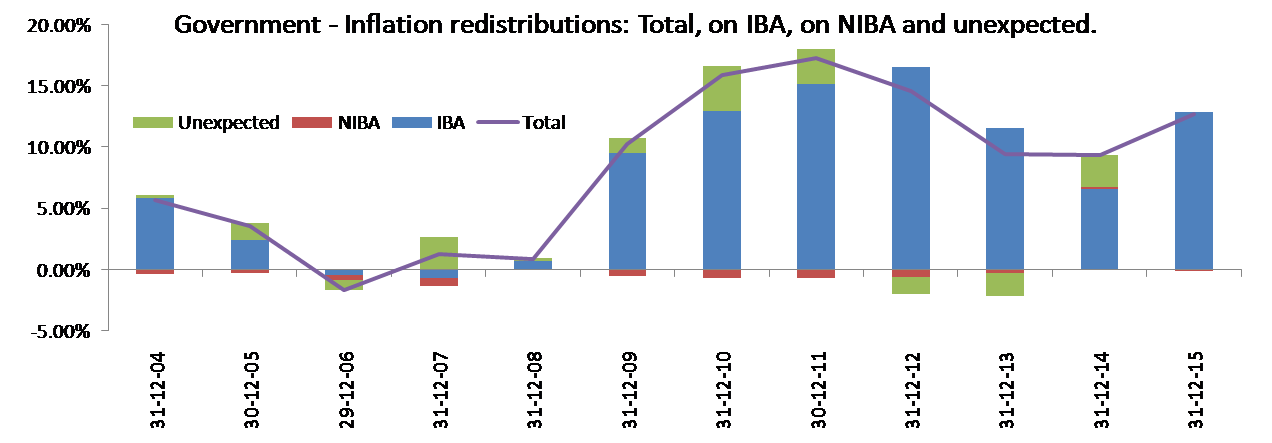
Figure 4. Inflation induced redistributions for the Government*.
IBA= Interest bearing assets
NIBA= Non-interest bearing assets
Unexpected= redistributions caused by errors in inflation expectations.
* As a share Government Revenue.
The results about the government are similar to those of non-financial corporations, with positive redistributions on IBA, given the debtor position of the government and the low level of interest rates. The positive redistributions are particularly large since 2009, reaching a peak of around 15 per cent of government revenue in 2011 and 2012. The positive redistributions recorded in the 2004-2015 period have the same sign as those obtained in the 1985 paper, but are much lower in size.
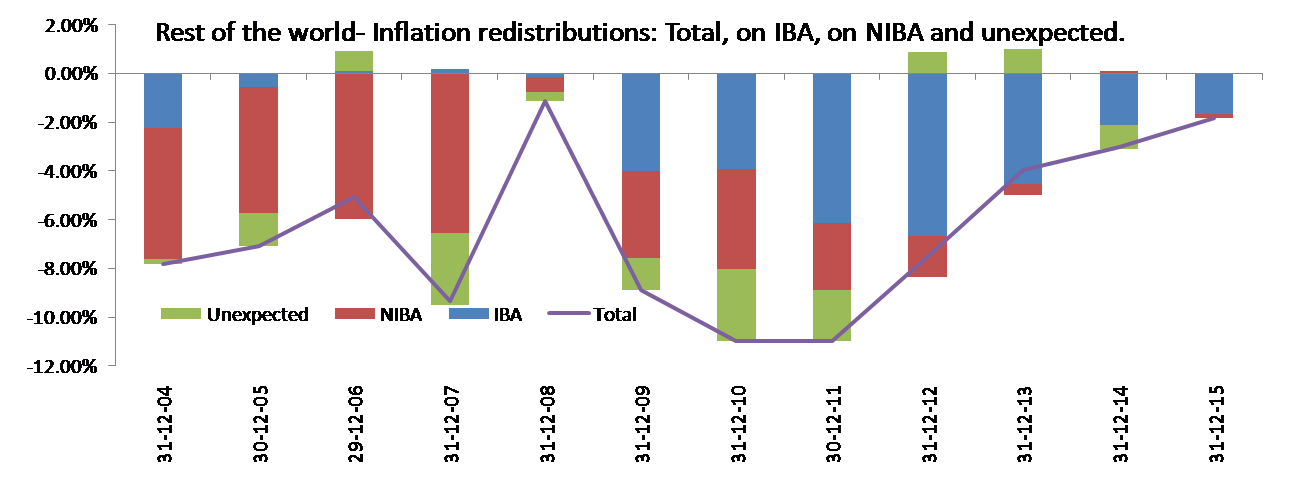
Figure 5. Inflation induced redistributions for the Rest of the World*.
IBA= Interest bearing assets
NIBA= Non-interest bearing assets
Unexpected= redistributions caused by errors in inflation expectations.
* As a share of Exports.
Also for the rest of the world the results show quite a difference between the first part and the second part of the sample period: in the first part negative redistributions on NIBA prevail; in the second part the most important role is played by redistributions on IBA, again due to the very low interest rate.
Overall, perhaps surprisingly, the low level of interest rates, in particular since 2009, has produced redistribution of wealth between Households, on one side, and Non-Financial Corporations and the Government, on the other side, analogous to those produced in the 1970s and 1980s by high inflation. Two differences are to be noted, however, in the recent results with respect to those observed for the earlier experience: first, Financial Corporations suffered negative redistributions, unlike in the earlier period; second, unexpected inflation played a much lesser role in recent years.
Appendix
I. IBA and NIBA for each of the above sectors, as well as for the euro area as a whole, were computed based on the following series avalable in the ECB Statistics Database:
- Monetary gold and special drawing rights;
- Currency and deposits;
- Short term debt securities
- Long term debt securities;
- Loans;
- Equity and fund shares;
- Insurance and pension schemes;
- Other.
For all of these series, both the assets and the liabilities were considered.
The liabilities series were subtracted from the assets side.
After this stage, we proceed to the calculation of IBA and NIBA.
- For each sector we computed NIBA as the sum of “Monetary gold and special drawing rights” and “Currency and deposits” on a net basis.
- For each sector we computed IBA as the sum of the remaining series, on a net basis.
II. The redistributions were computed using the following methodology:
We used the following scale variables
- Final Consumption Expenditure for Households;
- Gross fixed Capital formation for Non Financial Corporations;
- Net disposable income for Financial Corporations;
- Total revenue for Government ;
- Exports of goods and services for the Rest of the World.
In the equation below
the definition of the variables is as follows:
it =1 year Euro Swap rate;
πet = 1 year EUR Inflation Breakeven rate;
iN = the nominal interest rate was assumed as 1.5%, looking at the average of 5 years in 1998-2015 period with lowest inflation.
Lit = IBA;
Mit = NIBA;
u(t+1) = difference between the 1 year inflation breakeven and the actual rate;
The partial redistributions are estimates of the three parts in the equation above, divided by the sector variable for each sector.
The total distribution is the sum of the above three partial distributions.
This post was prepared with the assistance of Madalina Norocea
- Page 322.[↩]
- Page 322. [↩]
- The equation in the text is the linear approximation, the precise formula is the following, but for currently very low rates of inflation and interest rates the two formulas deliver practically the same results : Rit=(it + πet – iN +iit πet) Lit + πetMit + ut+1 [(1+iit)(Lit + Mit )] [↩]


