Should we worry that we have about the lowest interest rates in the history of humanity?
The prospects of rate increases by the FED are one special focus of attention of markets: Greece flirtation with € exit and then the reestablishment of a working relationship with its creditors, the financial typhoon hitting China, the sharp equity losses in advanced economies, the volatility of markets are seen not only as important events in themselves, but also as possible influences on the decisions of the FED. Is one or the other event making the probability of a December or a 2016 increase more or less likely? And now even October is seen as a possibility. And what about the pace of the subsequent increases?
Compared with this level of attention, markets are much more relaxed about possible interest rates moves by the ECB. This is fully understandable, given that the prospect of an increase of rates by the ECB is much more distant in the future and the probability of a further lowering is low. Still, I believe that examining interest rate prospects in the €-area over a medium term horizon raises some intriguing questions about the €-area monetary policy. Indeed, when we look at these prospects with a fresh eye they are quite surprising. Just to anticipate my conclusion, the assessment about the current ECB monetary policy depends on a seemingly weakly related issue, i.e. whether we believe or not that the €-area, and indeed the global economy, is in a secular stagnation period or suffering from a savings glut.
I will look at the medium-term prospects for interest rates according to three different perspectives to ascertain whether they give a coherent picture and what this picture is. Then I will draw some conclusions.
The first, obvious, perspective is to see what is inbuilt into the € yield curve.
This is done in chart 1, where the one year forward EONIA rates implicit into the Overnight Index Swap curve are reported.
Chart 1. EONIA forward curve
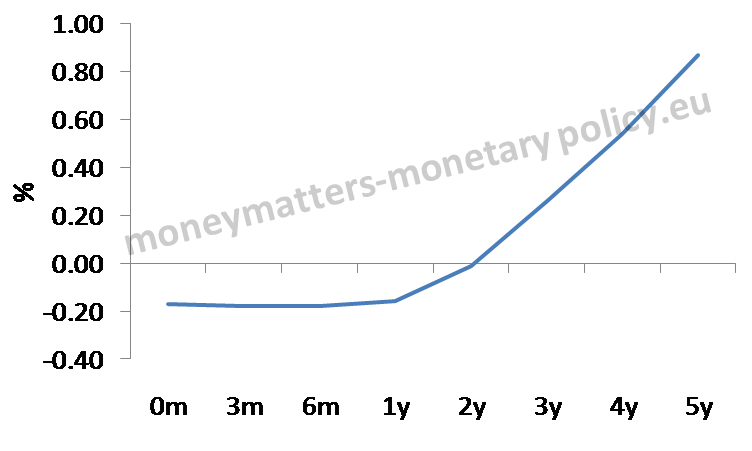
Source: Barclays, Cut off date 28 September 2015
We can see in the chart that overnight rates in the €-area are supposed to remain around current level (-20 b.p.) for this year and the next (i.e. for the spot one year rate and the one year rate one year forward), to only become positive for the one year forward rate prevailing 2 years from now and growing only to 60 b.p. for the forward rate prevailing between a 4 and a 5 year horizon. The one year forward rate prevailing 5 years from now further grows to above 80 basis points, but my horizon is limited to the first five forward rates, i.e. from now until 4 years from now.
To derive from this curve expectations about the ECB repo rate we must make some assumptions about the excess liquidity prevailing in the € area and about the width of the ECB rate corridor. In fact, as illustrated in some previous posts[1], the position of EONIA rate within the corridor depends on the outstanding excess liquidity. The simplified story is that, for an amount of excess liquidity higher than around 250 billion, the EONIA rate will gravitate close to the rate on the deposit facility. Instead, for an amount of liquidity just matching the liquidity deficit, the EONIA would be close to, indeed just above, the ECB repo rate. Given that the market expects EONIA to be close to -15 b.p. for the next 24 months, the obvious interest rate/excess liquidity configuration for this period is that the ECB rate corridor will remain at its current level (-20 b.p. for the Deposit rate, +5 b.p. for the Main Refinancing Operation -MRO- rate and 30 b.p. for the rate on the Marginal Lending Facility) and that excess liquidity will continue to be well above the 250 billion level.
The story gets a little more open in some 24 months from now, when EONIA starts increasing and two configurations are then possible.
According to a first configuration, excess liquidity could come gradually down towards zero, reaching this level 4 years from now. This would push EONIA into positive territory, even if the ECB corridor rate would not be changed.
According to a second configuration, excess liquidity could remain above the 250 billion level going forward.
These two possible configurations are consistent with what Trichet used to call the “separation theorem”, according to which excess liquidity and interest rates can, to an extent, move independently.
Whether one or the other configuration will prevail depends on what excess liquidity will in fact do. In order to project excess liquidity one would need to extrapolate the entire Eurosystem balance sheet, according to the simplified framework presented in a recent ECB publication[2]. The critical factors to carry out this projection are three: first, the liquidity provided through the Longer Term Refinancing Operations (LTRO); second, the duration of the Quantitative Easing program; third, whether the ECB will reinvest maturing securities bought under QE or not. If the size of the LTROs would substantially decrease (say about halve), if QE would be stopped, as currently foreseen, in September of next year and if the ECB would, unlike the FED, not reinvest the proceeds of maturing securities, then excess liquidity would be close to zero in 4-5 years time. If either of the three above assumptions would not prevail, there could still be an amount of excess liquidity exceeding 250 billion at that date.
Assuming that indeed excess liquidity would gradually go down to zero, the EONIA would be just above the deposit facility rate in the next two years and instead position itself just above the Main Refinancing Rate (MRO) of the ECB in 2019-2020. This means that the MRO rates consistent with the EONIA curve in Chart 1 would be, assuming that the width of the ECB rate corridor remains constant, at around 5 basis points in 2016 and 2017 and 50 basis points in 2020. Thus there would be two standard 25 basis points increase in the MRO rate between now and then. If, instead, excess liquidity would remain high even in later years, the EONIA would remain close to the deposit facility rate and there would be need to be up to three increases of the MRO rate over a five-year horizon to match the EONIA forwards in chart 1. In either case the level of ECB policy rate would remain exceptionally low.
A second, completely different, approach to gauge what the prospects for the medium term development of interest rates are is to start from a Taylor rule estimated for the € area and input into it macroeconomic projections for growth and inflation. For this purpose I use here the latest ECB projections and the forecasts from the professional forecasters, as in the following table.
Table 1. ECB Macroeconomic projections
| Projections | Inflation | GDP growth | Unemployment |
| 2015 | 0.1 | 1.4 | 11.0 |
| 2016 | 1.1 | 1.7 | 10.6 |
| 2017 | 1.7 | 1.8 | 10.1 |
| 2020 | 1.9 | 1.7 | 9.0 |
Source: ECB macroeconomic projections for the years 2015 to 2017 and ECB professional forecasters for 2020.
I take the traditional specification of the Taylor rule that has the following configuration and parameters:
it = 0.04 + 1.5 (πt – 0.02) + 0.5xt
Where πt is the rate of inflation while xt is the output gap, expressed as potential minus actual growth. The natural, or no-gap, interest rate is 4.0% and the desired inflation level is 2.0%.
Inputting the macroeconomic projections of table 1 in the chosen Taylor rule gives the relevant interest rates for the years for 2015, 2016, 2017 and 2020:
Table 2. Taylor rule interest rates, per cent*.
| 2015 | 2016 | 2017 | 2020 |
| 1.10 | 2.75 | 3.70 | 3.95 |
(*): Considering Potential Output constant at 1.5%.
Of course, only the extrapolations relating to the later years can be taken seriously: even assuming that there will be a normalization of interest rates this will surely not take place in 2015 or even in 2016.
We see in table 2 that the Taylor-rule interest rates are much higher than the MRO rates implicit in the OIS curve. Just taking 2020, the end of the considered horizon, the Taylor rule would of course give an interest rate of about 4.0 per cent, very close to the natural level, given that both the economy would be close to equilibrium with very small inflation and output gaps, while, as argued above, the MRO rate would be between 50 and 75 basis points in the final year. This is a result important in itself.
The Taylor-rule results obviously depend not only on the estimated parameters and on the inputted macroeconomic projections but also on the “zero-gap”, or natural, interest rate, i.e. the interest rate that would prevail if inflation and growth were both at their desired level. In current conditions it is doubtful, however, that the assumption of 4.0 per cent for the natural rate in the chosen Taylor rule is realistic. It is indeed useful to recall that, in the original formulation of Wicksell, the disequilibrium between the “natural” and the “monetary” interest rate, which determines inflation, was assumed to depend more often from moves of the former rather than the latter. This is indeed a difference between the original Wicksell theory and the Taylor rule, which can be taken as its offspring: in the former, the natural rate was assumed to be more variable than the monetary rate, in the latter the opposite assumption is maintained. The recent hypotheses of Summers and Bernanke, to which I will further refer below, referring to changes in the equilibrium rate are, from this point of view, a return to the original Wicksell theory.
Just building on the assumption of a variable natural rate, we can get an alternative estimate of this rate, by inverting the Taylor rule through inputting on its left side as monetary rate the ECB Main Refinancing Operation rate derived from the market expected rate, as presented in Chart 1. Specifically it is assumed that excess liquidity gradually goes down to zero and that the MRO rate moves to 50 b.p, over a five year period. This exercise gives the results in the following table.
Table 3. Natural interest rate from inverting the Taylor rule, per cent.
| 2016 | 2017 | 2020 |
| 1.39 | 0.35 | 0.55 |
The difference between natural rate implicit in the traditional Taylor rule, i.e. 4 per cent, and that obtained “inverting” it gives another perspective on how exceptionally low interest rates are and are supposed to remain in historical comparison. Indeed the implicit, no-gap, natural rate should be only around 50 basis points in 2020, when, according to available macroeconomic projections, both inflation and activity would be very close to their desired level, in order to justify a monetary rate as low as the one implied by the OIS curve in chart 1. This issue is further explored below in a secular perspective.
A third perspective to get a sense of what interest rates could do in the €-area over a medium term horizon is of a literary nature, i.e. to look at whatever statements one can find from the ECB about this expected path.
I found an explicit and clear statement on this issue in a September speech by Peter Praet, stressing the importance of fundamental and long term economic developments to explain exceptionally low interest rates (emphasis added): “Very low interest rates are not so much a choice of the central bank as a reflection of economic malaise in the global and euro area economy. Some of the drivers of that malaise are secular, which are more challenging for public policy to affect. But others are related to demand conditions that appear weak even when compared with a long-term potential growth rate that is already disappointingly low.”
In the same vein Benoît Cœuré, in September 2015, said:
“Growth has returned and the unemployment rate is falling in the euro area. We can trust in the euro to protect us in an international environment where major emerging economies are experiencing a slowdown and financial markets are very volatile. The European Central Bank is protecting growth by clearly stating that its policy of very low interest rates and its asset purchases will continue for as long as necessary. But growth is still not strong enough to create a sufficient number of jobs.”
And Constancio expressed the same concept in August:
“Sometimes the criticism directed at our policies implicitly attributes responsibility for the low interest-rate environment to central bank policies. But the truth is precisely the opposite: central banks are simply reacting to and trying to correct a situation that they did not create. Indeed, medium and long-term market interest rates are mostly influenced by investors and market players, as the recent so-called “bund tantrum” illustrates. More importantly though, it should be pointed out that for a few decades now we have been witnessing a sort of secular trend towards lower real interest rates. This trend is related to secular stagnation in advanced economies, resulting from a continuous deceleration of total productivity growth and an increase in planned savings accompanied by less buoyant investment prospects. Monetary policy short-term rates are low because of those developments, not the other way around. At the same time, our monetary policy has to be accommodative precisely in order to normalise inflation and growth rates, thereby opening up the possibility of higher interest rates.”
So, also in ECB utterances we find the idea that interest rates are very low, and, the ECB adds, this is likely to be persistent because of fundamental reasons.
The story so far is that, whatever perspective one uses, the very low rates that are prevailing now are expected to remain at the current level over a medium term horizon: their compressed level is not a phenomenon soon to be reabsorbed. Taking into account that the close to zero interest rate level prevails, in the euro-area, as well as in the US, since more than 5 years, there is the prospect of a decade or more with rates in the vicinity of 0 [3]. Add, if you wish, that the very large expansion of the European Central Bank balance sheets can be seen as a further push down of a “shadow” interest rate and you get the full picture of an exceptional situation.
To further see how extraordinary the situation is, one can look at current interest rates in a secular perspective. This is done in charts 2 and 3, where long, and when available, short interest rates are reported for the US, the UK and two countries now in the €-area, France and the Netherlands.
Chart 2. Secular behaviour of long-term interest rates: US, UK, Netherlands and France.
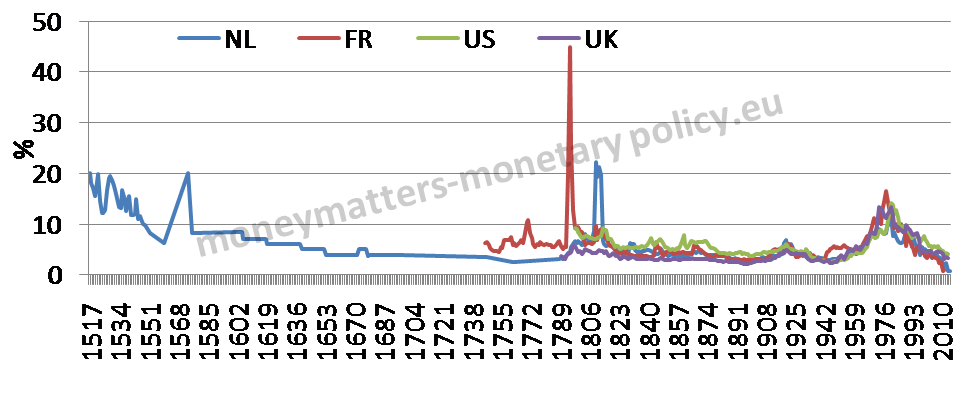
Source: Lawrence H. Officer, “What Was the Interest Rate Then?” MeasuringWorth, 2015
URL: http://www.measuringworth.com/interestrates/
Chart 3. Secular behaviour of short-term interest rates: US, UK and France

Source: Lawrence H. Officer, “What Was the Interest Rate Then?” MeasuringWorth, 2015 URL: http://www.measuringworth.com/interestrates/;.
In the charts one sees that both long-term and short-term interest rates are at their lowest, or very close to their lowest, levels since accurate enough recordings were made, meaning in the 16th century for the Netherland and in the 18th for the other three countries. In all cases, as can be seen in table 4, current interest rates are in the lowest percentiles since the beginning of the time series.
Table 4. Rates are lower than in the per cent of the cases reported below.
| France | United Kingdom | United States | Netherlands | |
| Short-term | 98 | 99 | 97 | .. |
| Long-term | 99.6 | 54 | 82 | 99.7 |
If you are looking for a very long-term average across countries, looking at table 5 you would not be way off target assuming 5.5 per cent as a “normal” across countries long-term rate and something like 3.5 per cent for short-term rates. Now at around 0 we are, of course, very far from those historically prevailing levels
Table 5. Very long averages of interest rates
| France | United Kingdom | United States | Netherlands | |
| Short-term | 3.66 | 4.01 | 3.21 | .. |
| Long-term | 5.7 | 4.39 | 5.75 | 6.00 |
If you think that half a millennium of data is not long enough to draw conclusions, you can try and expand the observations by a few millennia looking at the Homer and Sylla book[4]. There, in data going back 5.000 years ago, it is very hard to find interest rates below 3 per cent and hardly any observation below 1 per cent, leave alone at zero. Going through Babylonian, Egyptian, Greek, Roman, Medieval, Renaissance and Modern times there are period of low rates, for instance in Italy in the 16th and 17th century, still hardly ever as low as we see them now.
The observation that interest rates are at a multi century low is interesting enough. What is even more interesting, including for monetary policy, is to understand what are the reasons of this very low level. Here the “Savings glut” of Bernanke or the “Secular stagnation hypothesis” of Summers are relevant. Either of the two interpretations can explain why the “natural”, interest rate is so low and justify the very low policy rates of the ECB and other advanced economies central banks.
Very low inflation rates give some credence to the hypothesis that something basic is at play. The total break of the money multiplier. i.e. of the link between monetary base, or bank reserves, and monetary aggregates reinforces this view. What I find more attractive in the savings glut variant is that, as I understand it, the exceptionally low interest rates would be persistent but not a quasi-permanent state of affairs, as in the secular stagnation hypothesis.
However, if we cannot find good, fundamental reasons why equilibrium interest rates are so low, keeping them at current levels would not be justified. Indeed, if Goodhart and co-authors[5] are right, the time of very low interest rates (and inflation) will be surpassed before too long.
I think the debate between monetary policy hawks and doves in the €-area would be more fruitful if it gave more emphasis to the question whether indeed the equilibrium interest rate is so low because of fundamental, long-term economic developments or not[6].
A last observation can be made about the €/dollar exchange rate: if indeed the ECB would increase rates very modestly for the next five years, while the FED complied with its “dots”, according to which interest rates in the longer run (can we say this is 2020?) would be at 3.5 per cent, the interest differential should be quite powerful in bringing up the value of the American currency.
[1] Prepared with the assistance of Madalina Norocea.
Liquidity supply and demand in the €-area: a schematic approach; Is the ECB really so generous?; Three liquidity scenarios after the year-end; € liquidity is getting more valuable: what can be done about it?
[2]The role of the central bank balance sheet in monetary policy, ECB Economic Bulletin, Issue 4, 2015.
[3] I do not do much of the fact that some interest rates, including the deposit rate of the ECB, is not zero but negative. For my story a rate of -20 basis points can be considered „close to zero“ without loosing any precision.
[4] Sidney Homer, Richard Sylla , A History of interest rates, Wiley 2005
[5] C. Goodhart, Manoj Pradhan and Pratyancha Pardeshi,Global Issues Could Demographics Reverse Three Multi-Decade Trends?, Morgan Stanley
[6] The speech by S. Rossi, Monetary policy in a low growth, low interest rate environment, “Roundtable on Monetary Policy in a Low Growth, Low Interest Rate Environment”, Istanbul Finance Summit, Istanbul, 8 September 2015, is a valuable contribution in this direction.

Thank you for this analysis, Francesco!
Two questions, if I may:
1. From where do you derive the threshold of €250bn in excess liquidity as determinant for the behaviour of EONIA? Empirical observations in the past that may or may not be meaningful when extrapolated into the future?
2. Isn’t it conceivable that both Wicksell and Taylor can help us understand the properties of the natural interest rates? In your piece it sounds very much like an either/or?
Your views on this would be highly appreciated. Best, Niels
Dear Niels,
many thanks for your questions.
My 250 threshold is a simplification of a somewhat more elaborate analysis I carried out in the posts mentioned in the last one in which I showed that if excess liquidity is very ample EONIA tends to position itself just above the deposit rate while if it is around 0 EONIA tends to be just above the MRO rate. The theoretical justification for this is that if there is a lot of liquidity the only relevant rate is the one on the deposit facility at which banks can invest excess liquidity at the ECB. If excess liquidity is around zero there is equal probability of banks having a deficit or a surplus of reserves and thus EONIA will get close to the middle of the corridor, where the MRO rate is. 250 billion is the (approximate) level of excess liquidity for which EONIA gets close to the deposit facility.
Wicksell and Taylor are indeed close, however have different views about the natural rate. Taylor more or less that it is constant and does not pay much attention to it. Wicksell think the variability of the natural rate is higher than that of the monetary rate and tries to identify the fundamental forces that determine it. So, at the end, yes, both Wicksell and Taylor give us insights to understand the natural rate.