Market versus policy Europeanisation: has an imbalance grown over time?
This Policy Contribution tests the hypothesis that an imbalance has grown in Europe over the last few decades because markets have integrated to a greater extent than European-level policymaking, potentially creating difficulties for the democratic process in managing the economy. This hypothesis has been put forward by several authors but not so far tested empirically.
To evaluate the process of European market integration – or market Europeanisation – over the last few decades, we assess intra-European trade and intra-European capital flows.
Any estimate of policy integration, or Europeanisation, meanwhile, is fraught with difficulties and only proxies can be measured. Our preferred proxy is the number of employees of the European institutions and agencies relative to the aggregate number of public employees in national administrations in the European Union. The assumption is that European public employees generate, implement and oversee European policies and thus their relative number is a proxy for the development of European policies. An alternative indicator of policy Europeanisation is the relative frequency of European Union news in major national media outlets, as a proxy for the relevance to the public of European policies.
Our results show that, measured by our proxies, policy Europeanisation has developed more rapidly than market Europeanisation, measured on the basis of both trade and capital flows. It is however also noted that the relative number of public employees has outpaced the relative frequency of European Union news in the media, possibly indicating a technocratic slant in policy Europeanisation. Further research could test the robustness of our results, in particular by using other measures of policy Europeanisation, such as the impact of European legislation on national laws and regulations.
Introduction
Charles Kindleberger’s hegemonic stability theory1 holds that policymaking, fragmented according to national borders, cannot properly manage globally integrated markets, thus creating a risky imbalance. In the absence of a global government, a hegemon that internalises the gains from stabilising the world economy could produce the needed global governance. But a hegemonic system failed during the Great Depression, thus depriving the international economy of this ersatz governance approach.
Kindleberger’s basic idea was that the public good of economic governance is under-produced at international level and this is a problem because a thriving economy needs both a strong private sector and effective public governance.
Dany Rodrik (2017) developed an analogous argument. He put forward the idea of an inconsistent triangle, at the points of which are democracy, national sovereignty and (hyper) globalisation. The trilemma asserts that only two of the three components can coexist. In current conditions, national sovereignty and (hyper) globalisation seem to prevail, to the detriment of democracy. In fact, (hyper) globalisation has overwhelmed, in Rodrik’s view, national policymaking, which is incapable of democratically governing the world economy2). Rodrik applied his trilemma inconsistency to the entire world as well as to Europe. His specific point about Europe was that an imbalance has developed between economic integration, which has advanced tremendously, especially with the single market and the single currency, and political integration, which has not undergone a similar development.
Rodrik does not seem to definitively exclude that progress in political European integration could, sometime in the future, remedy the imbalance, making democracy and globalisation again consistent. But he seems to be sceptical that political integration can progress sufficiently3.
Rodrik’s view, building on Kindleberger, rings correct but lacks a firm quantitative basis. Markets are not perfectly integrated and policymaking is not only national, and as soon as we recognise this, the need arises for a quantitative measurement to compare the market and policy integration processes. ‘Policy’ is here meant in a broad sense, including high-level policy decisions and their implementation through more technical actions4).
The issue is very complex and a perfect approach to it might not be available. Still, the question is too important to be left without an attempt to provide an empirical answer. This Policy Contribution addresses the issue in a European context, leaving the extension to the global sphere to subsequent research.
Our strategy to get closer to an empirical handling of the issue is to calculate two indices (detailed in section 1):
- An index of market integration (market Europeanisation);
- An index of policymaking integration (policy Europeanisation);
and then to compare how they have developed in order to start answering the following questions:
- Has market Europeanisation really gone further than policy Europeanisation?
- If so, by how much?
- And how has the relationship between the two developed over time?
We do not directly address the question of whether an imbalance exists because market Europeanisation exceeds policy Europeanisation and therefore the effectiveness of policies has been undermined. We just measure how any possible imbalance has moved over the last half century (section 2). This approach can answer questions such as whether we should worry more about the imbalance now than previously, but not whether there is an absolute imbalance.
Furthermore, our estimates of market and policy Europeanisation at most provide an approximation of the underlying phenomena. As far as market Europeanisation is concerned, there are in the literature different proposals on how to measure globalisation, which is what in this Policy Contribution is more pedantically termed market Europeanisation. On policy Europeanisation there is no literature of which we are aware, and the approach we propose should be interpreted as a first attempt to measure a proxy rather than as a definitive estimate. We also briefly describe in section 3 some alternative measurement options.
Measuring market and policy Europeanisation
Market Europeanisation
There are three kinds of market Europeanisation that one could consider:
- Trade Europeanisation, measured by comparing intra-European trade growth with domestic income growth;
- Financial Europeanisation, measured by intra-European capital flows with respect to domestic financial variables;
- Labour integration, measured by intra-European migration flows.
We concentrate here, partly because of data availability, on trade (see section 3 for a brief analysis of financial Europeanisation). To estimate trade Europeanisation we start with a time series of intra-EU trade (Figure 1).
Figure 1: Intra-EU trade – Real Imports and Exports (1970-2018). Billions of constant euro
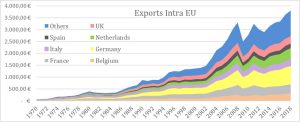
Source: Bruegel based on OECD International Trade and Balance of Payments Database- Quarterly International Trade Statistics.
Figure 1 shows a very steep, if somewhat irregular, increase in real intra-European trade, both for exports and imports. All countries have contributed to the increase, with Germany in a dominant position, but smaller countries, grouped under the ‘others’ label, also grew in importance (though in part because of their increasing number following EU enlargements). Intra-European trade is computed as the sum of the exports/imports of all 28 European Union members to/from the other members. We included a number of countries in the calculation starting from the dates of their independence: Estonia, Lithuania and Latvia (independence from the Soviet Union); Croatia and Slovenia (break-up of Yugoslavia); and the Czech Republic and Slovakia (dissolution of Czechoslovakia).
Figure 2: Intra-EU trade – Real Imports and Exports (1970-2018). Billions of constant euro. Aggregate figures. Log scale.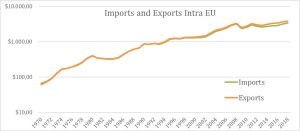 Source: Bruegel based on OECD International Trade and Balance of Payments Database- Quarterly International Trade Statistics.
Figure 2 shows that intra-EU exports and imports grew at a rapid pace between 1970 and about 1990, but growth slowed somewhat thereafter. There was even a drop in trade with the onset of the Great Recession, but then trade recovered and resumed growth, though at a slower pace.
Looking at trade data is only the first step, since income has also grown substantially in the half century covered by Figures 1 and 2. The subsequent necessary step to measure trade Europeanisation is to divide intra-EU trade by EU GDP, as in Figure 3.
Figure 3: Intra-European Union trade as a percentage of EU GDP
Source: Bruegel based on OECD International Trade and Balance of Payments Database- Quarterly International Trade Statistics.
Figure 3 shows an increase in trade relative to GDP from 1970 up to the Great Recession, but no strong trend since. Over the entire period, trade as a share of GDP increased from 5 percent to 15 percent or slightly more. Compared to the developments shown by Figure 2, the increase is much more muted because both trade and GDP figures are influenced by real growth, in addition to inflation. The time series in Figure 3 is our preferred measure of market Europeanisation.
Policy Europeanisation
Calculating an index of policy Europeanisation is much more difficult than measuring market/trade Europeanisation. To do so, we estimated, in several steps, the ratio of the total number of people working in European administrations to the aggregate number of people working in national administrations. We consider ‘administrations’ to mean strictly administrative bodies, such as, for instance, the European Medicines Agency, but also political institutions, including the European Parliament and the European Commission, while excluding gatherings of national experts that lack a significant permanent structure, such as many EU technical groups. However, committees established by the EU Treaty or other EU legislation are included 5).
The estimation of this ratio is fraught with conceptual and practical difficulties. To estimate the numerator, we started from a time series census of European public administrations (institutions and agencies). The list of European public administrations is in Appendix 1. Then we collected information on how many people work in these organisations and how this number has changed over time. The denominator is the aggregate number of people working in the national administrations of EU countries.
On top of statistical difficulties, this ratio as a proxy for policy Europeanisation has limitations. It does not take into account that many people working in national administrations contribute to the management of the European economy. For example, the Eurosystem, composed of the European Central Bank (ECB) and national central banks (NCBs) of euro-area countries, had about 48,500 employees in 2017, of which only 3,200 worked for the central institution – the ECB. According to our definition, only this small number of people would qualify as working in European public administration, while the much larger number of people working for the NCBs would be defined as working in national public administrations, though a sizable share of NCB staff members contribute to running the monetary policy of the euro area, thus carrying out a European rather than a national task. On the other hand, one could say that European public bodies are less effective than national organisations, so, for the same number of public employees, they could contribute less to managing Europe.
Figure 4 shows the number of European public administrations from the 1940s until today, along with the participation of groups of EU countries in those administrations: the six founding members of the European Community (Germany, France, Italy, Netherlands, Belgium and Luxembourg); the countries of western Europe (Austria, Greece, Ireland, Portugal, Spain, United Kingdom); the countries of northern Europe (Denmark, Estonia, Finland, Latvia, Lithuania, Sweden) the countries of central/Mediterranean Europe (Bulgaria, Croatia, Czech Republic, Hungary, Poland, Romania, Slovakia, Slovenia, Cyprus, Malta). Participation of these groups in European public administrations has roughly, but not strictly, followed the timing of the accession of countries to the EU.
About 70 EU-level organisations presently exist. Another 40 have been created and then closed down. A perusal of the list of European public organisations in the Appendix is interesting, as it shows that practically all fields of public administration are now covered, from electronic communication to health, from judicial affairs to food safety, from gender equality to terrorism, radicalism, extremism and violence internationally, and so on.
Figure 4. Number of European public administrations (1948-2019).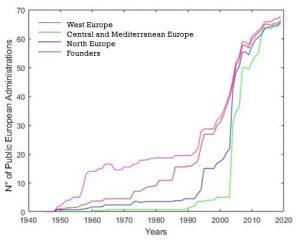
Source: Yearly report of European Institutions published in European Court of Auditors website for the European employees.
Figure 5 shows the total number of employees of European public administrations. Unfortunately, data is only available from 1970 onwards and thus the large jump in the number of European public bodies (and likely associated staff numbers) which took place in the second half of the 1950s (Figure 4) is not taken into account.
Figure 5. Number of employees of European public administrations (1970-2018).
Source: Bruegel based on annual reports of European institutions published on the European Court of Auditors website.
Still, the progression is remarkable: in 1970 there were fewer than 9,000 employees in European public administrations; by 2018 the number had increased to nearly 74,000, or an eight-fold increase. We categorised European public administrations as follows: EU core (including the Parliament, Commission, Council); EU agency (all agencies linked with the European Union); non-EU (intergovernmental institutions with a broadly EU membership but not directly linked to the European Union). The bulk of the increase in staff numbers came from the EU core group, reflecting the predominance of the EU’s most important bodies, such as the European Commission, in European public administration. However, the staffing of EU agencies increased most percentage-wise.
The time series shown in Figure 5 is still not an adequate measure of policy Europeanisation. What we need is a measurement of European public administration relative to national administrations, as proxied by the respective employee numbers. Figure 6 shows the relevant time series.
Figure 6: Number of employees in European public administrations as a percentage of the aggregate number of employees in national public administrations (1970-2018)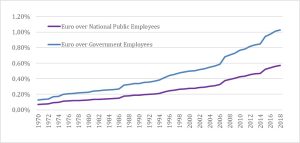
Source: Bruegel based on ILOSTAT and EUROSTAT Database for national public employees (both with and without defence, health and education employees); annual reports of European institutions published on the European Court of Auditors website for the European employees.
Figure 6 shows two measures of the ratio of European to national public employees. The first has as the denominator the total aggregate number of public employees in EU countries, while the second subtracts from the denominator employees working in education, health and defence, in which the EU has no or a minimal role.
Figure 6 shows that, under both definitions, the number of employees working for European public administrations remains a small fraction of the number of employees of national public administrations. But in percentage terms this fraction has increased by a factor of about eight, a significant increase in its relative importance.
Comparing market and policy Europeanisation
To estimate market and public Europeanisation, Figure 7 shows the number of employees of European public administrations relative to the number of employees of national administrations, divided by intra-European trade relative to EU GDP.
Figure 7. Ratio between the number of employees in European public organizations as a ratio of aggregate employees in national public administrations divided by the ratio between intra-EU trade and EU GDP. Index 1970=100. (1970-2018).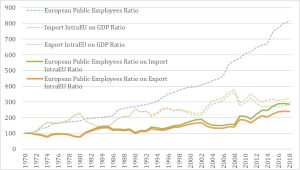
Source: Bruegel based on OECD, ILOSTAT, and EUROSTAT Database; Yearly report of European Institutions published in European Court of Auditors website for the European employees. The series of the European Public Employees ratio is the one excluding employees in health, education and defence.
Figure 7 indicates, unsurprisingly, that both policy and market Europeanisation have increased very much in the half century between 1970 and 2018. What is more interesting, however, is that the number of public sector employees as a share of the aggregate of national employees has grown, as we saw in Figure 6, by a factor of eight, while intra-European trade as a share of GDP has grown only by a factor of about three. Thus the ratio between the two indices has grown by a factor of between 2.5 and 3 in the half a century covered by Figure 7, indicating that, according to our measures, policy Europeanisation has developed significantly faster than market Europeanisation.
Figure 7 shows that the trend in the ratio has mostly reflected the trend increase in policy Europeanisation, while the deviations around the trend have been mostly determined by the ups and downs of market Europeanisation around its trend.
The increase in the ratio is not really visible until the beginning of the 1990s. Until that time, policy and market Europeanisation developed at similar pace. This means that none of the institutional developments until approximately that time (the enlargement to include the UK, Denmark and Ireland in 1973; the first direct elections to the European Parliament in 1979; the enlargement to include Greece in 1981 and Spain and Portugal in 1986; the approval of the Single European Act establishing the Single Market) brought about a visible change in the relationship between the two kinds of Europeanisation. The more rapid pace of policy Europeanisation compared to market Europeanisation began roughly with the approval of the Maastricht Treaty in 1993. It thus seems that the big innovation of the single currency was accompanied by an increase in policy Europeanisation. In 1999, the euro was launched, covering 11 countries, with an increase since then to 19 countries. After 2004, there was a further acceleration of policy Europeanisation relative to market Europeanisation when 10 new countries joined the EU, followed by Bulgaria and Romania in 2007. Coinciding with the financial crisis, which started in 2008, there was a new, even more visible acceleration in policy Europeanisation relative to market Europeanisation, because of both a reduction in trade and institutional innovations, leading to more intense policy Europeanisation.
Alternative measures of market and policy Europeanisation
As we have noted, the two measures of Europeanisation developed in this paper only aspire to be proxies of the underlying phenomena. It is interesting to see if other possible measures confirm the results they deliver.
As mentioned in section 2.1, an alternative measure of market Europeanisation to that based on trade is financial integration, illustrated by cross-border capital flows in the EU.
This is done in Figure 8, which shows an index of the cumulation of intra-EU capital flows, i.e. foreign assets relative to total financial assets, alongside the measure of policy Europeanisation used in Figure 7. Unfortunately, the time series only begins in 2001 and thus we have only about two decades of data, compared to the five decades available for trade6.
Figure 8. Number of employees in European public organisations divided by the aggregate employees in national public administrations and intra-EU foreign assets divided by total aggregate financial assets. Index 2001=100. (2001-2018).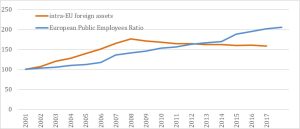
Source: Bruegel based on Yearly report of European Institutions published in European Court of Auditors website for the European employees. The series of the European Public Employees ratio is the one excluding employees in health, education and defence. Zsolt Darvas for intra-EU foreign assets.
Figure 8 shows that market Europeanisation, as measured by intra-EU foreign assets, grew at a fast space during approximately the first decade of the existence of the euro, outstripping the growth of policy Europeanisation. But thereafter, it gently declined. Policy Europeanisation showed instead a more regular increase and, at the end of the period, exceeded financial market Europeanisation. Thus the data confirms, over the shorter time period available, the conclusion obtained using the trade Europeanisation measure.
An adjacent, but different, measure of policy Europeanisation to that used in this paper is the frequency of European issues in the printed press7. The increase in the number of articles mentioning the European Union relative to the total number of published articles can be interpreted as a sign of more active public opinion at European level. A bolder interpretation of that evidence, still to be verified, is that more frequent mentions of European matters in the printed press is an indication of the gradual growth of a European demos8.
Figure 9 compares the development of the frequency of European news in four media outlets (Le Monde, La Stampa, Die Zeit and Der Spiegel), as preliminarily estimated by Bergamini et al (2019), with our preferred measure of policy Europeanisation.
Figure 9. Ratio between the number of employees in European public administrations and the aggregate employees in national public administrations and frequency of European news over all published news in Le Monde, La Stampa, Die Zeit and Der Spiegel. Index 1970=100. (1970-2018).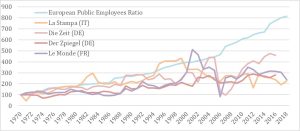
Source: Bruegel based on yearly report of European Institutions published in European Court of Auditors website for the European employees. The series of the European Public Employees ratio is the one excluding employees in health, education and defence. The frequency of European news is drawn from Bergamini et al (2019).
Figure 9 shows that, over the entire period, policy Europeanisation grew, as previously noted, by a factor of eight, while the frequency of European news with respect to the total published news increased by a factor of between two and five, depending on the press organ.
The increase in the two phenomena can be taken as evidence that market Europeanisation has been accompanied by policy Europeanisation, in terms of both an increase in the number of public European employees and greater public opinion attention paid to European matters. However, the fact that the former has grown more than the latter might indicate that policy Europeanisation of a technocratic nature has progressed even more than a genuinely political Europeanisation process.
Conclusions
Based on the measures presented in this paper, one would have to conclude that there has been no growing imbalance in the last half century between market and policy integration in the EU. If an imbalance existed in 1970, it has reduced, particularly since 1990. The fear, expressed in particular by Rodrik (2017), that European democracy would suffer because of market Europeanisation not being matched by policy Europeanisation, is not justified by our empirical evidence. This overall result is robust to the use of different indicators, but the different time spans for which they are available should be taken into account. Some evidence also emerges from the empirical exercise that technocratic policy Europeanisation may have progressed more than genuinely political Europeanisation.
Further empirical checks are needed to corroborate the findings presented in this Policy Contribution. A potentially fruitful line of further empirical analysis would be to measure policy Europeanisation through the impact of EU legislation on national law-making.
This post was prepared with the assistance of Leonardo Cadamuro. Useful comments were received from Emmanuel Mourlon-Druol, Guntram Wolff, Zsolt Darvas, Simone Tagliapietra, Grégory Claeys, Enrico Bergamini and Maria Demertzis.
- See Kindleberger (1973 and 1988).[↩]
- See also Saccomanni (2008[↩]
- Along similar lines, Lindseth (2010) argued that, in the absence of a genuine European demos, the process of European integration can only have an administrative rather than a constitutional character, and thus lacks autonomous democratic foundations.[↩]
- On a very important event at the highest level of policy making in Europe see Mourlon-Druol (2012[↩]
- For an analogous exercise, stressing its difficulties while also looking at the reasons for creating new administrations and at their functions, see Mourlon-Druol (2019[↩]
- See Darvas (2019) for calculations based on data from the European Commission’s Finflows dataset, which estimates bilateral external assets and liabilities of EU, Organisation for Economic Cooperation and Development and other countries.[↩]
- Bruegel research is at the time of writing ongoing on this issue; see Porcaro et al (2019).[↩]
- Bergamini et al (2019) try to ascertain whether a fledging process of Europeanisation of public opinion, which can be interpreted as a necessary basis for democratic policymaking, has accompanied the increasing Europeanisation of economic, social and political life.[↩]
